Latino Voters in the 2021 Recall Election
Executive Summary
California’s recent recall election offers an opportunity to understand how the state’s politics are changing with its electorate. Since the last recall election in 2003, the state’s electorate has grown more diverse and multiracial. According to UCLA LPPI research, Latino voters increased by nearly 150 percent since the last recall election in 2003, while Asian-American voters grew by 122 percent. In contrast, the growth of white voters over the past two decades was only 5 percent. As of the 2020 General Election, Latinos composed 27.9 percent of all registered voters in California.
Using precinct-level vote data from the 2021 Recall Election and demographics from UC Berkeley’s statewide election database, this report provides an analysis of Latino voting patterns in 18 California counties, including how voting patterns varied by geography. We match precinct-level data on votes cast in the 2021 recall to the estimated percentage of Latino voters in the most recent election with data available, excluding precincts without a match or with fewer than 25 votes.
Using this data, we estimate the percentage of Latino voters who voted “Yes” and “No” in each county using a Loess regression line. For our statewide results, we estimate Latino “Yes” and “No” votes using a King’s ecological inference model. In total, the 18 counties selected for our analysis represent 81.4% of California’s population and 81.5% of the state’s Latino population.
Our main findings are:
- Latino voters mobilized later than others. The single-biggest day of Latino votes was September 14, 2021, the day of the recall election.
- Total Latino turnout stands at 1,823,798 statewide.
- Latino voter turnout was 30 percent.
- In most counties, support for Governor Newsom increased as the concentration of Latino voters in precincts increased.
- Statewide, an estimated 78.1% percent of Latinos voted against the recall election. High support for Governor Newsom among Latinos is broadly unchanged from the 2018 election.
- Regionally, the most important patterns are:
- In Southern California, Latino support for Governor Newsom was upwards of 75 percent, even in historically Republican Counties like Orange and Riverside County.
- In Central California, Latino voters were more likely to vote opposite of non-Latino voters.
- Support for Governor Newsom among Latinos was highest in the Bay Area. Contra Costa displayed the strongest Latino support for Governor Newsom with 93 percent of Latinos rejecting the recall.
- In Northern California, Governor Newsom received a similar share of votes compared to 2018.
- Similar to non-Latinos, the majority of Latinos voters cast their ballot by mail. However, in Los Angeles, San Francisco, and Tulare counties, Latino voters were more likely to vote in-person when compared to non-Latinos.
Figure 1. 78.1% of Latinos Statewide Voted Against the Recall
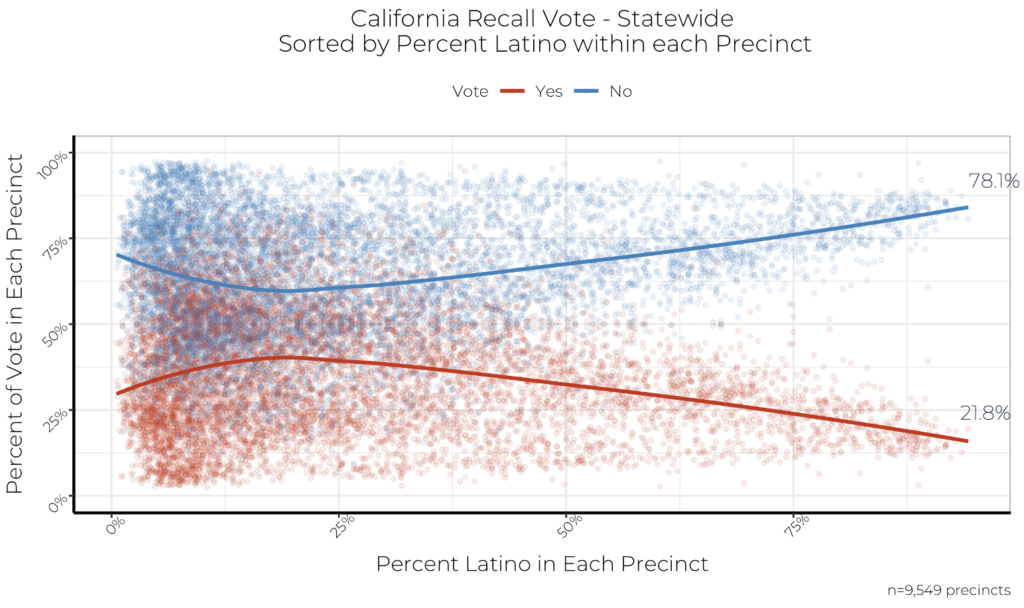
Source: LPPI analysis of County Registrar of Voters, Statement of Votes Cast.
Notes: Chart includes 18 counties: Alameda, Contra Costa, Los Angeles, Madera, Merced, Orange, Riverside, Sacramento, San Bernardino, San Diego, San Francisco, San Luis Obispo, San Mateo, Santa Clara, Sonoma, Stanislaus, Tulare, and Ventura Counties. Statewide Latino and non-Latino votes estimated using King’s ecological inference model.
Table 1. Counties Included in Analysis
|
County |
Latino Voters (% NO) | Non-Latino Voters (% NO) |
County Results |
| Southern California | |||
|
Los Angeles County |
83% |
70% |
70.8% NO |
|
Orange County |
81% |
40% |
51.7% NO |
|
San Diego County |
80% |
57% |
57.2% NO |
|
Ventura County |
82% |
56% |
57.2% NO |
| Inland Empire | |||
|
Riverside County |
76% |
45% | 50.5% YES |
|
San Bernardino County |
74% | 38% |
50.2% NO |
| Central California | |||
|
Madera County |
77% |
30% |
61.2% YES |
|
Merced County |
76% |
15% |
52.0% YES |
|
San Luis Obispo County |
50% |
62% |
52.8% NO |
|
Stanislaus County |
75% |
24% |
54.5% YES |
|
Tulare County |
82% |
37% |
61.1% YES |
| The Bay Area | |||
|
Alameda County |
76% |
85% |
81.2% NO |
|
Contra Costa County |
93% |
70% |
71.5% NO |
|
San Francisco County |
88% |
79% |
86.1% NO |
|
San Mateo County |
87% |
74% |
78.0% NO |
|
Santa Clara County |
78% |
74% |
73.8% NO |
| Northern California | |||
|
Sacramento County |
74% |
49% |
62.0% NO |
|
Sonoma County |
85% |
74% |
73.7% NO |
Source: LPPI analysis of County Registrar of Voters, Statement of Votes Cast.