The Cost of Fear: The Impacts of Immigration Enforcement on Small Businesses and Latino Entrepreneurs in LA County
Photo credit
Featured photo: MSPhotographic on iStock.
Executive Summary
Los Angeles County is home to 4.76 million Latinos, nearly half of the county’s population.1 Latinos power the county’s economy, owning 374,000 businesses, more than a quarter of all firms (28%).2 Despite these economic contributions, Latino-owned businesses face disproportionate barriers to starting and growing, including limited access to capital, mentorship gaps, and greater vulnerability to crisis.3 These challenges were compounded by the 2020 COVID-19 pandemic4 and climate disasters.5
In June 2025, immigration enforcement operations surged in commercial corridors serving Latino and immigrant communities across Los Angeles County,6 creating a “chilling effect” that drove customers away from the businesses anchoring these corridors.7 This report builds on previous LPPI research examining the impacts of immigration enforcement on the Latino community, from Medi-Cal enrollment,8 to labor force participation,9 to educational outcomes.10
This report examines how the June 2025 surge affected commercial activity near nine enforcement sites and the experiences of Latino entrepreneurs across Los Angeles County. It pairs mobility data on foot traffic to businesses within a half-mile of each site with focus groups and surveys of 75 of these entrepreneurs. Together, these methods revealed five key findings.
- Enforcement produced an immediate economic shock, and the businesses closest to enforcement sites were hit hardest. Eight of the nine sites studied saw reduced foot traffic, with the steepest declines closest to each site and smaller declines radiating outward. One week after an enforcement operation, foot traffic dropped by 1.91% for businesses within 0.25 miles and by 0.93% for those between 0.26 and 0.50 miles away. In week two, those declines deepened to 3.23% within 0.25 miles and 1.63% between 0.26 and 0.50 miles.
- Within two weeks, formal businesses across the nine enforcement sites experienced 46,000 fewer visits and an estimated $3.16 million in accumulated losses. Notably, these estimates capture only formal businesses and exclude the street vendors, home-based businesses, and food trucks that make up much of the Latino small-business economy.
- The enforcement surge substantially disrupted business operations. Among the Latino entrepreneurs interviewed, every respondent reported fewer customers and sales after the ICE raids. In surveys, 59% of business owners reported that sales dropped by more than 50%, 68% temporarily closed or reduced their hours, and 51% reported that staff missed work out of fear.
- Financial instability has persisted and deepened since June 2025. About 95% of Latino entrepreneurs reported ongoing financial stress nearly a year after the enforcement surge: 52% reported that revenue no longer consistently covers operating costs; another 43% are breaking even with little or no profit. To stay open, entrepreneurs have laid off workers, worked longer hours, and taken on new debt.
- Enforcement operations generated serious health and psychological consequences. In the survey, 76% of respondents reported that enforcement affected their wellbeing. Entrepreneurs described gastrointestinal disorders, insomnia, panic attacks, worsening chronic conditions, and other stress-related illnesses. These effects were a consequence of enforcement and a mechanism that reduced entrepreneurs’ capacity to sustain their businesses.
Together, these findings show that the June 2025 enforcement surge caused immediate and lasting economic harm. Within days it emptied storefronts across the county’s Latino commercial corridors. A year later, the crisis is not over. Many of these businesses remain in debt, barely breaking even, and struggling to stay open. These consequences extend far beyond commercial corridors. As immigration enforcement continues, it endangers the health, wellbeing, and safety of entire communities.
Introduction
Beginning in spring 2025, intensified federal immigration enforcement operations altered daily life in cities across the United States. News and policy reports documented declines in commercial activity following raids and other highly publicized enforcement operations, particularly in commercial districts serving Latino and immigrant communities.11 Los Angeles County emerged as a highly visible site of intensified immigration enforcement beginning in June 2025, when Immigration and Customs Enforcement (ICE) and U.S. Customs and Border Protection (CBP) agents conducted large-scale operations across commercial corridors that serve as important economic and social hubs for immigrant communities. The enforcement campaign also targeted residential neighborhoods and public places.12
In Los Angeles, immigration enforcement activity included roving patrols, street sweeps, raids, detentions, and the sustained presence of hundreds of heavily armed federal agents. The federal government’s deployment of 4,000 National Guard soldiers and 700 Marines to support enforcement operations further militarized the region.13 These operations were conducted using force and, in numerous documented instances, resulted in serious injuries to both immigrants and U.S. citizens.14 Overall, enforcement activity disrupted daily life, generated widespread anxiety and fear, and prompted protests and community mobilization.
Though this report focuses on Los Angeles, the commercial and social disruptions it documents reflect consequences that reach far beyond the region. Studies have found that enforcement activity produces a “chilling effect” that reduces participation in health care, education, civic life, and other routine activities.15 Moreover, a study from the UC Merced Community and Labor Center found that immigration enforcement led to declines in private sector employment, with fewer people reporting private sector work in both California and Washington, D.C. after enforcement escalations. 16 An analysis by the Bay Area Council Economic Institute found that mass deportations would result in billions of dollars of losses in the San Francisco Bay Area, particularly in labor intensive industries like agriculture and construction. 17 Lastly, additional analyses of the 2025 enforcement surge have documented declines in consumer spending, mobility, and commercial activity in cities across the United States, including the greater Los Angeles region.18 Together, these findings illustrate the cost of enforcement across state and local communities.
This report examines how intensified federal immigration enforcement affected commercial activity in immigrant business corridors and the Latino-owned businesses that operate within them. Home to one of the nation’s largest immigrant populations, Los Angeles County contains extensive commercial districts sustained by Latino businesses and consumers. These districts encompass both formal and informal enterprises, such as restaurants, food trucks, street vendors, swap meet sellers, beauty salons and barber shops, and other small businesses. These businesses play an important role in neighborhood economies throughout the region and are particularly sensitive to changes in customer traffic and participation in public and commercial life.
This report combines neighborhood-level mobility data and interviews with Latino business owners to examine changes in commercial activity following immigration enforcement operations and the experiences of business owners in affected communities.
Three patterns emerge from these data. First, the June 2025 ICE raids triggered immediate economic disruptions, reducing foot traffic and resulting in over $3 million in accumulated losses across nine study sites within two weeks of enforcement activity. In focus groups and surveys, Latino entrepreneurs described an abrupt and widespread downturn in their operations. Second, these disruptions persisted after the initial enforcement period, leaving many businesses with depleted savings, accumulated debt, and abandoned plans for growth or investment. Third, entrepreneurs reported substantial health and psychological consequences that affected their businesses.
Data and Methods
This study uses a mixed-methods design combining neighborhood mobility data with focus groups and surveys of Latino business owners across Los Angeles County. The quantitative analysis examines changes in commercial activity after immigration enforcement operations, while the qualitative analysis documents how business owners experienced and responded to these economic disruptions.
Mobility Analysis and Economic Estimates
The quantitative analysis uses mobility data from Advan Research, which compiles anonymized mobile phone location data to estimate visits to individual businesses over time. We measure foot traffic as the number of business visits recorded in the Advan data and use the two terms interchangeably throughout this report. Using these data, we examined changes in foot traffic near nine documented immigration enforcement operations that took place in June 2025. For each site, we compared visits to nearby businesses in the two weeks before the operation with visits in the two weeks after, measured within two concentric buffers, a quarter-mile ring and a half-mile ring. Some analyses report the inner and outer rings separately; others report the combined half-mile buffer.
Figure 1 shows the locations of these enforcement operations, the quarter-mile and half-mile buffers used in the analysis, and the Latino population share across Los Angeles County. The map shows that most enforcement operations were concentrated in predominantly Latino neighborhoods. Appendix A describes how enforcement sites were identified.
Figure 1: Immigration Enforcement Sites and Latino Population Share in Los Angeles County
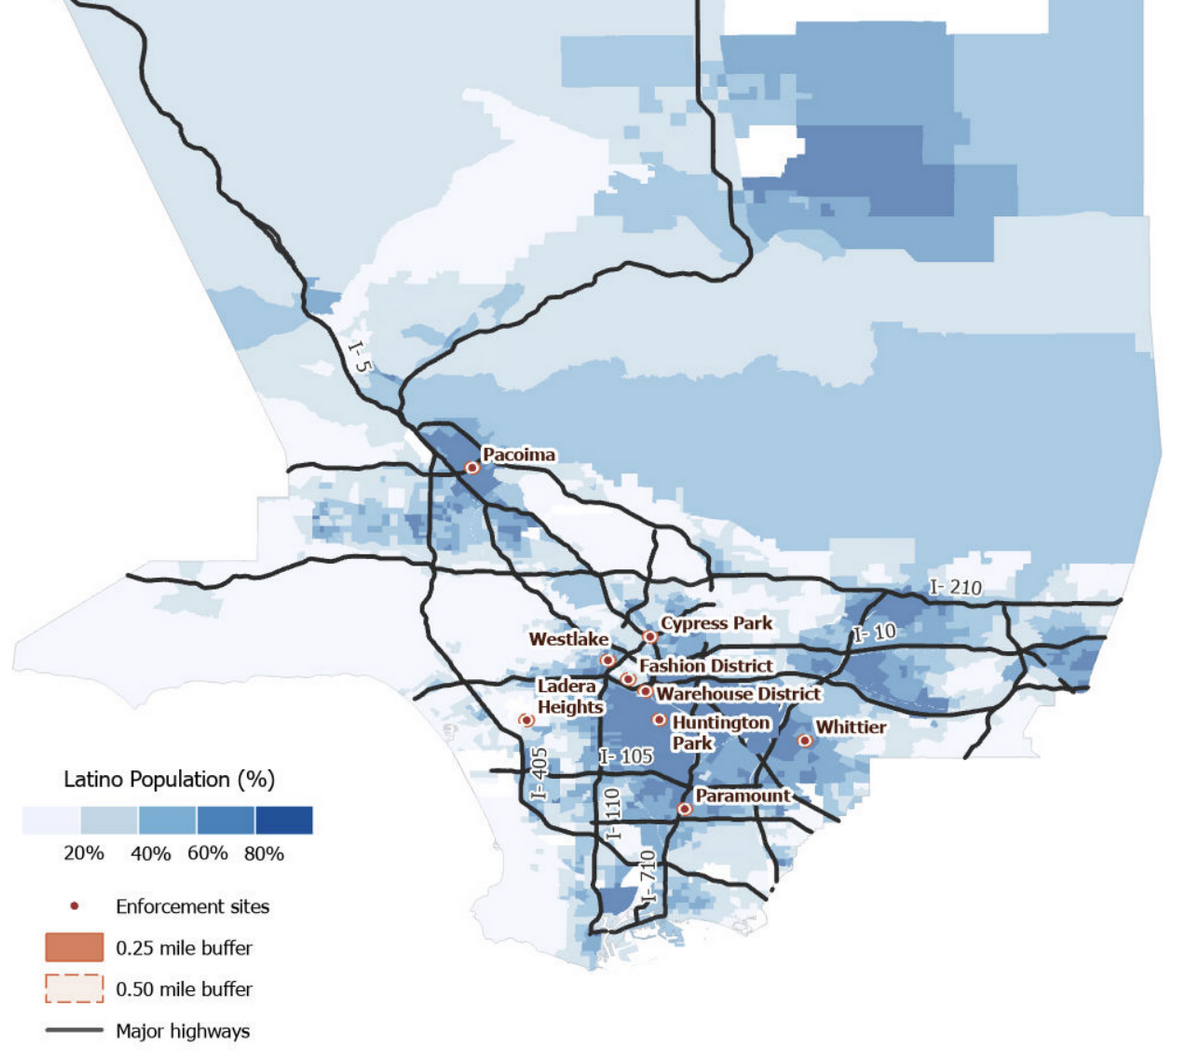
Source: LPPI analysis of U.S. Census Bureau, American Community Survey, 2018–2022, “ACS Race and Hispanic Origin Variables — Boundaries/Tract,” via Esri ArcGIS Living Atlas.
To estimate revenue losses after enforcement operations, we multiplied the decline in business visits by the typical customer spending for that business type, adjusted for Los Angeles prices.
The economic estimates include only formal businesses at fixed locations, such as storefronts, restaurants, and other points of interest captured in Advan Research’s mobility data. However, because much of the commerce in immigrant corridors is informal, these estimates understate the enforcement surge’s total economic impact. Appendix A provides additional information on the data, analytic methods, and calculations for these estimates.
Focus Group Interviews and Surveys
The qualitative analysis draws on nine focus groups conducted between April and May 2026 with 75 small-business owners operating across Los Angeles County. All participants also completed a brief survey that collected information about their businesses and the impacts of immigration enforcement. Participants included informal vendors, food truck operators, home-based food producers, restaurant owners, store owners, and service providers from East Los Angeles, the San Fernando Valley, the Harbor area, and surrounding communities.
Most focus groups were conducted in Spanish, and participants represented a range of immigration experiences and legal statuses. Discussions explored changes in customer demand, business operations, financial conditions, and experiences during and after the 2025 enforcement surge. Appendix B provides additional information on participant recruitment, focus group procedures, and qualitative analysis.
Part 1. Commercial Impacts of Immigration Enforcement
The June 2025 immigration enforcement surge produced measurable declines in commercial activity across Los Angeles County’s commercial corridors, many of them anchored in Latino and immigrant communities. This section documents changes in foot traffic and estimated revenue around nine enforcement sites during the two weeks following each operation, covering formal businesses within walking distance of each site (a quarter-mile and half-mile radius, or buffer).
Finding 1: June enforcement activity negatively affected the businesses closest to immigration enforcement sites, and its effects worsened over time and spread beyond the immediate area.
Businesses within 0.25 miles and between 0.26 and 0.50 miles saw foot traffic declines that worsened after enforcement activity (see Figure 2). One week after enforcement activity, foot traffic dropped by 1.91% within 0.25 miles and 0.93% between 0.26 and 0.50 miles. By the end of week two, those declines widened to 3.23% and 1.63%, respectively. This suggests that the effect of enforcement activity spread beyond the immediate area, with businesses several blocks away experiencing reduced foot traffic in the two weeks that followed.
Figure 2: Foot Traffic Declines by Distance from Enforcement Sites and Days since Enforcement
Source: LPPI analysis of Advan Research, Foot Traffic/Weekly Patterns Plus data, 2025.
Finding 2: The June enforcement activity triggered immediate economic disruptions across commercial corridors: 46,000 fewer business visits among formal businesses across nine enforcement sites, resulting in an estimated $3.16 million in accumulated losses within two weeks of enforcement activity.
Consistent with the foot traffic declines, estimated revenue losses mounted steadily across the two-week post-enforcement period, with the sharpest losses among businesses closest to enforcement sites. Within two weeks, businesses within 0.25 miles had lost an estimated $2.11 million, roughly double the estimated $1.05 million lost by businesses between 0.26 and 0.50 miles away (see Figure 3). This points to a chilling effect19 that was strongest for those closest to enforcement sites but that still extended to those farther away.
These figures understate the full economic toll on Los Angeles businesses. Our analysis covers only nine enforcement sites, a fraction of the operations across Los Angeles County during this period,20 and captures just the two weeks following the first documented action at each site. Given the scale of enforcement activity, the true cumulative loss is far greater than the figures reported here.
Figure 3: Cumulative Estimated Business Revenue Loss by Distance from Enforcement Site, Days 1–14
Note: X axis = days since enforcement activity; Y axis = estimated cumulative dollar losses.
Source: LPPI analysis of Advan Research, Foot Traffic/Weekly Patterns Plus data, 2025.
Finding 3: The magnitude of commercial disruption varied considerably across sites, reflecting differences in corridor composition and enforcement activity.
In the two weeks following immigration enforcement activity, eight of the nine sites saw fewer business visits (see Table 1), and the size of those declines varied. Paramount had the largest decline at -11.0%, followed by Ladera Heights at -4.8%, the Warehouse District at -4.3%, and Cypress Park at -3.0%.
The magnitude of percentage decline did not always correspond to the scale of estimated economic loss. The Fashion District had one of the smaller foot traffic declines (-2.4%), yet is estimated to have lost the most revenue ($1.52 million), nearly half the total estimated loss across all nine sites. In contrast, Paramount, with the largest foot traffic decline, is estimated to have lost less ($367,000).
This divergence is partially a reflection of the number of businesses within each site’s buffer. Our data show over 550 businesses within a half mile of Ambiance Apparel, where ICE conducted an operation on June 6, 2025, compared with 18 businesses within a half mile of the Paramount site (see Table 1).
Paramount’s steep decline also coincided with intense disruption in the corridor itself. In early June, Paramount was a focal point of sustained federal activity as agents staged operations, and streets were closed or difficult to access amid a heavy federal presence.21 These circumstances made it difficult for customers to reach local businesses.
The nine sites varied in demographic character, from heavily Latino, immigrant neighborhoods to a historically Black community (Ladera Heights) and downtown commercial districts; notably, the commercial effects of enforcement were not confined to majority-Latino areas (see Appendix A, Table A1).
Table 1: Foot Traffic Declines and Estimated Revenue Losses by Enforcement Site (within 0.5 miles)
Note: All estimates calculated within 0.5 miles of enforcement sites, two weeks post-enforcement activity.
Source: LPPI analysis of Advan Research, Foot Traffic/Weekly Patterns Plus data, 2025. Dollar losses are estimated by applying sector-specific spend-per-visit rates to observed visit declines. Spend-per-visit rates are documented in Appendix A.5.
Finding 4: Discretionary spending sectors experienced the steepest declines in commercial activity.
The economic disruption produced by immigration enforcement did not affect all business sectors equally. Discretionary spending categories, including retail and services, experienced the largest declines in foot traffic. This suggests customers deferred non-essential purchases and reduced social outings in response to enforcement activity (see Figure 4).
Retail Complexes experienced the largest decline at -4.37%, followed by Services (-3.36%), Big-Box Retail (-2.89%), Specialty Food & Drink (-2.49%), Retail (-2.27%), and Restaurants (-1.06%). Multi-tenant retail complexes and personal-service businesses saw the steepest drops. Sectors with more moderate declines, such as restaurants, are especially vulnerable to these reductions because they depend on discretionary spending and operate on thin margins.
Essential-goods sectors, such as grocery, showed slight increases in foot traffic (0.65%), suggesting that customers continued purchasing necessities even as they reduced other commercial activity. While research on the behavioral impacts of immigration enforcement finds that it suppresses participation in numerous essential activities,22 our analysis suggests that grocery shopping is largely unaffected.
Figure 4: Foot Traffic Declines by Business Sector within 0.50 miles of Enforcement Sites, Two Weeks Post-Enforcement Activity
Source: LPPI analysis of Advan Research, Foot Traffic/Weekly Patterns Plus data, 2025.
Broader Economic Implications
ICE’s June 2025 enforcement surge drove immigration arrests in the greater Los Angeles region to 2,425 in a single month, roughly seven times the number of arrests recorded just six months earlier.23
Our analysis captures only a small share of this activity: a two-week snapshot of foot traffic declines within 0.50 miles of nine enforcement operations in June, out of 471 actions reported across Los Angeles between June 6 and July 20.24
To produce illustrative estimates of enforcement’s broader impact on LA County businesses, we apply a modest aggregate county-wide decline in foot traffic of 1.0% (roughly two-thirds of the 1.63% decline measured at the outer bands of the study sites across all the sectors) to six of the seven sectors examined (see Appendix C for details). This implies estimated county-wide revenue losses of approximately $52 million within two weeks of heightened immigration enforcement activity and $114 million over a month. The parameters, assumptions, and limitations behind these figures are detailed in Appendix C.
Notably, these illustrative estimates capture only economic losses stemming from reduced business visits. They do not capture lost labor productivity as businesses closed early or workers skipped shifts and stayed home, forgone wages for those workers, or the ripple effects as money failed to circulate through the local economy. Nor do they account for additional harms reported by entrepreneurs, including debt accumulation, deferred investment, and the physical and psychological tolls of trying to keep businesses open under adverse economic circumstances. These broader impacts are taken up in the qualitative findings that follow.
Part 2. What Latino Entrepreneurs Reported
The qualitative findings reveal that the foot traffic declines documented in our quantitative analysis — roughly 1–3% on average, and as much as 11% at the hardest-hit site — understate the impact of enforcement on Latino-owned businesses, whose customers were concentrated in the communities most affected.
This report identifies three mechanisms through which the June 2025 enforcement surge affected Latino-owned businesses. First, immigration enforcement immediately reduced customer mobility, triggering sharp declines in commercial activity. Second, these initial losses evolved into prolonged financial instability characterized by persistent revenue declines, debt accumulation, labor intensification, and deferred investment. Third, sustained economic strain contributed to serious psychological and physical health consequences that further constrained business operations.
Finding 1: Immigration enforcement produced an immediate economic shock by driving away customers and disrupting commercial activity.
Immediately following the June 2025 enforcement surge, entrepreneurs across Los Angeles County reported a sharp decline in customer activity and sales. Fewer customers, canceled community events, and temporary business closures disrupted commercial activity across multiple sectors.
chaos. From that day on, people were afraid to go out. You would hear all
the merchants pulling down their metal gates.”
Immediate Revenue Losses
Every entrepreneur reported fewer customers and fewer sales following the enforcement surge. Among survey respondents, 59% reported that sales dropped by over 50%; another 20% reported revenue declines of 26% to 50%.
Figure 5: Reported Impacts of Immigration Enforcement
Source: UCLA Latino Policy and Politics Institute (LPPI), Pre-Focus Group Survey of Small Business Owners, 2026 (n = 75).
Many street vendors stopped working entirely, out of fear for themselves and their customers. Those who continued working did so out of necessity, and typically at a fraction of prior earnings. For example, a vendor who had previously averaged $1,000 in sales on weekends earned less than $300 after the raids. Because many respondents operated owner-managed microenterprises, financial shocks to the business quickly became financial shocks to the entrepreneur and their household.
Although the magnitude of losses differed across business types, respondents consistently described the same underlying process: immigration raids reduced customer mobility almost immediately as their Latino customers avoided public spaces.
Canceled Events, Orders, and Inventory Losses
June, July, August—all canceled. People were afraid. The restaurant was empty some days. Completely empty. I lost $20,000 in canceled catering
events alone.”
Businesses that relied on seasonal events experienced especially severe losses because immigration enforcement coincided with the peak summer celebration season. Entrepreneurs described cancellations of graduations, quinceañeras, weddings, baptisms, summer festivals, and markets that typically generated predictable seasonal income. Several business owners reported losing thousands of dollars in canceled catering orders and event contracts.
For many businesses, canceled orders resulted in unrecoverable expenses. Food vendors and restaurant owners discarded unsold perishable inventory that had been purchased in anticipation of summer demand. An event planner lost thousands of dollars after purchasing graduation decorations specific to the Class of 2025 before clients canceled their events. These cancellations produced two forms of economic loss: forgone revenue from canceled events and unrecoverable investments in inventory and event preparations.
Operational Adjustments
My daughters were frightened. I was trying to give them calm—nothing will
happen to us, we are fine. But seeing the worry in their faces and trying
to manage that while also keeping the restaurant running—that was its own
kind of stress.”
Sixty-eight percent of survey respondents temporarily closed or reduced operating hours in response to the enforcement surge, while 51% reported staff missing work because of fears of enforcement. In response to safety concerns and staffing shortages, businesses operated behind locked storefronts, reduced operating hours, shifted to appointment-only or referral-based service, and suspended social media advertising.
Although these adjustments were intended to protect business owners, employees, and customers, they also disrupted routine business operations. Microenterprises that depended on predictable hours and repeat customers found it difficult to rebuild customer traffic after repeated closures. Reduced visibility, combined with lower neighborhood activity, slowed recovery even after enforcement activity subsided.
Finding 2: Financial instability has persisted and deepened since June 2025.
Nearly one year after the enforcement surge began, respondents described financial instability as an ongoing condition rather than a temporary disruption.
of respondents reported ongoing financial stress almost a year later
The overwhelming majority of survey respondents reported continued financial stress: 52% said their revenue no longer consistently covered operating costs, while another 43% reported breaking even with little or no profit. Sales remained well below pre-enforcement levels for most respondents, and recovery was uneven. Beyond revenue declines, respondents emphasized the loss of predictability. Brief increases in customer activity were repeatedly interrupted by enforcement operations or rumors of enforcement, making it increasingly difficult to forecast revenue, purchase inventory, schedule employees, or make other routine business decisions.
Street vendors who had previously averaged about $300 per day reported earning $60 or less, while restaurants that once generated $8,000 to $9,000 in weekly sales reported operating at roughly 60% of their previous revenue.
Depleted Reserves and Debt Accumulation
Entrepreneurs took on debt to survive. As revenues remained depressed for months, respondents depleted their personal savings and relied on credit cards, bank loans, loans from family members, and informal lending networks to cover both business and household expenses.
More than 20% of our respondents (17 of 75) reported specific dollar amounts for new debt, loans, and depleted savings, totaling $547,000. Because many respondents described financial strain without reporting specific dollar amounts, this figure likely understates the cumulative financial burden across the study sample.
Income Replacement Strategies
As revenues remained depressed, many entrepreneurs supplemented declining business income by taking outside employment, modifying service models, and diversifying products and services. For example, a salon owner in Gardena adapted by making home visits, exhausting her credit, and ultimately selling a van to remain in business. One food vendor took construction jobs while his business operated at near-zero capacity for several months.
During extended periods of reduced demand, entrepreneurs subsidized their businesses from outside income to keep them alive and their households afloat.
Labor Intensification
Declining revenues also fundamentally changed how entrepreneurs organized their labor. As revenues fell, some respondents cut payroll and absorbed the work themselves. Business owners assumed responsibility for deliveries, purchasing, bookkeeping, transportation, customer service, inventory management, and administrative work while working significantly longer hours than before the enforcement surge.
For microenterprises operating with only a few employees, the loss of even one worker substantially increased owners’ workloads. Respondents described postponing hiring, relying on family members, or absorbing responsibilities that had previously been shared across multiple employees. These adjustments enabled businesses to remain open but shifted the burden of maintaining operations onto business owners themselves.
Deferred Investment and Business Contraction
As financial uncertainty persisted, many entrepreneurs abandoned growth-oriented strategies in favor of preserving or downsizing existing operations. Respondents described postponing equipment purchases, delaying expansion plans, reducing operating hours, consolidating locations, and scaling back staffing. Investments that had been under consideration before June 2025 were deferred indefinitely as business owners focused on maintaining sufficient cash flow to remain in operation.
Several respondents reduced the scale of their businesses in response to prolonged revenue losses. One mobile food vendor consolidated three vending locations into one, while a salon owner combined two locations to reduce rent and operating costs. Others described preparing for the possibility of relocation or closure.
Finding 3: Immigration enforcement generated serious health and psychological consequences for entrepreneurs.
Respondents consistently described declining mental and physical health as a consequence of immigration enforcement and a factor that further constrained their businesses. Fear of enforcement, prolonged financial uncertainty, and sustained economic pressure contributed to chronic stress, while worsening health reduced entrepreneurs’ ability to work and manage their businesses. Economic insecurity and health consequences reinforced one another.
of respondents reported substantial emotional impact
Chronic Fear and Psychological Distress
Survey data and focus group accounts told the same story: sustained fear, anxiety, depression, sleep disruption, hypervigilance, and stress that persisted long after the initial enforcement surge. Rather than representing a temporary emotional response, psychological distress emerged as an enduring condition that reshaped daily routines and business operations.
Entrepreneurs described limiting their movement outside work and home, carrying identification documents, monitoring community reports of enforcement activity, and developing contingency plans for themselves, their families, and their teams. These adaptations reflected efforts to reduce personal risk while minimizing disruptions to business operations and households. In two cases, family members were detained during enforcement operations.
Respondents also described carrying the emotional burden of others while managing their own anxiety. Business owners reassured frightened customers, comforted employees and family members, and projected confidence they did not themselves feel. Chronic psychological distress became an ongoing feature of business operations, shaping day-to-day decision-making, interpersonal relationships, and entrepreneurs’ capacity to sustain their businesses.
Physical Health Consequences
Respondents consistently linked prolonged stress and financial uncertainty to worsening physical health. Across interviews and focus groups, respondents described health issues including gastrointestinal disorders, insomnia, panic attacks, worsening chronic conditions, and other stress-related illnesses. Several reported beginning new medications, increasing the frequency of medical visits, or requiring hospitalization.
One wellness store owner described relapsing into alcohol use after maintaining sobriety, attributing the relapse to prolonged feelings of helplessness and loss of control during the enforcement period. She explained that the relapse contributed to a broader deterioration in her health, which in turn affected her ability to operate the business. As she described it, “because my health was struggling, the business was struggling.”
Immigration enforcement functioned as both an economic shock and a substantial source of psychological and physical harm. Fear, uncertainty, and financial strain contributed to worsening health, while declining health further constrained entrepreneurs’ capacity to sustain their businesses. Health consequences were both outcomes of enforcement and mechanisms that prolonged the economic damage.
These reinforcing processes help explain why many entrepreneurs remained economically vulnerable nearly one year after the initial enforcement surge, demonstrating that the consequences of immigration enforcement extended far beyond the immediate disruption of the operations themselves.
Conclusion
This report documents the economic disruption that the June 2025 immigration enforcement operations caused across Los Angeles County, adding to the growing body of work documenting the economic consequences of intensified immigration enforcement.25
The mobility analysis around nine documented enforcement sites — covering 989 businesses across a 0.5-mile radius — found that visits to businesses declined up to 11% in the weeks following enforcement operations.
The qualitative findings show that these figures translate into large losses for Latino small businesses. Many businesses in Latino communities reported losing much of their customer base. Across nine focus groups and survey responses, respondents described an economic shock that began immediately after the June 2025 enforcement surge and had not been resolved by the time of data collection, nearly a year later.
The financial costs were substantial and, for many respondents, enduring. Psychological and health consequences were not separable from the economic findings. Respondents described illness and financial loss as compounding rather than independent, with stress worsening health and declining health reducing the capacity to work and recover.
The businesses represented in this study are embedded in Latino commercial corridors that function as local economic systems: they employ neighborhood workers, purchase from local suppliers, and generate consumer activity in communities that have historically had limited access to mainstream financial institutions.26 The findings show that immigration enforcement disrupted local economies, affecting labor markets and customer bases on which these businesses depend. Research on small business recovery following economic shocks consistently finds that informal businesses and microenterprises face the longest recovery timelines and the highest permanent closure rates, in part because they lack access to the credit and relief mechanisms available to larger firms.27 Enforcement-driven economic shocks to Latino commercial corridors are not just temporary disruptions but durable losses.
Appendix
Appendix A: Commercial mobility and economic estimates
This appendix describes the data sources, sample construction procedures, and analytical methods underlying the foot traffic and revenue loss estimates presented in this report.
A.1 Foot Traffic Data
To measure changes in commercial activity following documented immigration enforcement operations, this analysis uses Advan Research’s Foot Traffic/Weekly Patterns Plus data, downloaded on March 8, 2026. Advan measures visits to commercial points of interest using anonymized mobile device location data collected from a large panel of opt-in devices. The unit of observation is daily visits to each commercial establishment, and visit counts are reported as state-normalized measures of foot traffic. We use Advan foot traffic data rather than SafeGraph Spend data because the latter relies on credit card transactions. Noncitizen households are unbanked at the highest rates, and two-thirds of unbanked households rely entirely on cash.28 Card-based spending measures do not capture the transactions of those most likely impacted by immigration enforcement.
A.2 Enforcement Location Data
We identified immigration enforcement actions, including arrests, workplace raids, and highly visible enforcement deployments, by searching local news sources for reports of immigration enforcement activity during the summer of 2025. We drew on reporting from the Los Angeles Times, NBC Los Angeles, ABC7, KTLA, CBS News, and The Guardian. Searches were conducted via Google News using keyword searches to identify enforcement actions and likely sites of immigration raids (keywords included ICE, immigration enforcement, arrest(s), raid(s), Home Depot, and carwash).
Precise address information was essential to our research design, so we relied on news reports that included specific geographic information about enforcement activity (such as an address, cross streets, or a named retail location), which we verified on Google Maps. Once the site address was identified and verified, we added the enforcement action to our tracker. Reports describing enforcement activity that could not be mapped to a specific site were excluded, even when the enforcement action itself was well documented. This method yielded 45 enforcement actions.
We constructed an analytic sample based on a number of criteria. First, we restricted our sample to immigration enforcement actions in Los Angeles County that occurred in June 2025. Because June marked the beginning of the immigration enforcement surge, limiting the sample to that month allows us to more clearly attribute changes in foot traffic to individual enforcement actions rather than to the broader surge or other events. There were 22 enforcement actions in our tracker that occurred in LA County in June 2025. Second, we selected enforcement actions that were anchored to a retail point of interest in the Advan data, excluding enforcement actions that were reported in residential neighborhoods. Third, where a single location was raided more than once during the window, we analyzed only the earliest June activity to avoid double-counting the same establishment. Fourth, we confirmed that selected enforcement sites did not have overlapping buffer zones.
Applying these criteria resulted in a final sample of nine enforcement sites which we identify in Table A1. Eight sites involved documented immigration arrests or raids. We also included the Paramount site, where no arrests were reported, because federal agents maintained a sustained and highly visible enforcement presence across the street from a shopping center. Since our analysis examines changes in commercial activity associated with exposure to visible immigration enforcement, we consider Paramount comparable to the other enforcement sites.
Table A1: Summary of Enforcement Sites
A.3 Commercial Locations: Sample Construction
Businesses located within each buffer zone were identified using Advan’s point-of-interest database. The analysis focuses on commercial establishment types most likely to depend on walk-in or neighborhood foot traffic: retail businesses (including large-format retail), grocery stores, restaurants and cafés, and personal service businesses.
Mobility records were then cleaned to ensure observations represented active businesses with complete visit data across both the pre-enforcement and post-enforcement windows. Duplicate businesses were removed, as were businesses with insufficient visit observations or mathematically implausible mobility values. AI-assisted screening was used for initial cleaning and to identify records for further review; all flagged records were subsequently reviewed manually by at least two members of the research team. Manual reviews involved verifying business locations using Google Street View, and using internet searches, Yelp listings, and other publicly available online sources to verify that businesses were active during the study period and that their business types matched the sector classifications in the Advan mobility data. As a result of manual review, 848 businesses were removed from the sample and 459 were reclassified. Across the nine enforcement locations, the final analytic sample comprised 989 businesses: 358 located within the 0.25-mile buffer and 631 within the 0.26 and 0.50-mile buffer.
Businesses were grouped into seven sectors based on Advan categories, verified and where necessary reclassified through the manual review described above. Grocery includes supermarkets and neighborhood food markets, and excludes wholesale grocers. Retail includes standalone stores selling goods. Retail Complex includes multi-tenant commercial properties such as indoor and outdoor shopping alleys that the mobility data sometimes record as a single point of interest rather than as individual storefronts. Big-Box Retail includes large chain retailers. The four present in these data are Home Depot, Costco, Lowe’s, and Target. Services include personal and household service businesses, spanning hair and nail salons, laundromats, wireless and phone repair shops, pet groomers, print and shipping shops, and automobile repair, among others. Restaurants include full-service and limited-service dining establishments. Specialty Food & Drink includes coffee shops, bakeries, boba and tea shops, drinking places, and other snack and beverage locations.
A.4 Analytic Framework
Following Jones’s “depressive effects” framework,29 changes in foot traffic were estimated by comparing mean daily visits during the 14 days preceding each enforcement operation with mean daily visits during the 14 days following the operation. This is a before-and-after comparison rather than a design with a separate control group. Although we did not estimate a difference-in-differences model, we did not observe a comparable decline in foot traffic during the same period in the year prior to the enforcement surge, which suggests that the observed declines reflect the June 2025 enforcement operations rather than seasonal patterns. Separate estimates were produced for two concentric buffers around each site, an inner ring within a quarter-mile and an outer ring between a quarter-mile and a half-mile, to assess how effects varied by proximity. Some analyses report these rings separately; others report the combined half-mile buffer.
A.5 Spend-per-Visit Rates by Sector
Each sector’s per-visit spending estimate draws from industry benchmarks, adjusted to Los Angeles price levels. A single average spend per visit applies to every business in a sector. For example, Costco and Lowe’s both fall under the broader “Big-Box Retail” category. That spend-per-visit figure is a visit-weighted average of the different business types within the broader category. These are rates adopted by the research team and corroborated against published benchmarks, not direct observations from the study sites.
Two adjustments applied across all sectors
Los Angeles Prices. National benchmarks underestimate spending in Los Angeles, so each figure is increased by an LA-specific per-person premium from the BLS Consumer Expenditure Survey (+17% Restaurants, +9% Services, +8% Retail and Big-Box; +7% for goods elsewhere from the BEA Regional Price Parities).30
One visit is not always one buyer. Grocery and Big-Box figures are per-transaction. A single shopper typically rings up a whole household basket. Restaurants are different: a dining party produces one bill but only some members carry a phone (e.g., children often do not carry phones), so a recorded visit covers more than one diner’s meal and the per-person check is scaled up by a people-per-visit factor.
Table A2: Estimated Spending Per Visit by Sector
Benchmarks and formulas by sector
Grocery ($30/$49/$90). The benchmark is the average supermarket transaction. The Food Marketing Institute (FMI), the grocery industry trade association, reports this each year. Its 2024 figure is about $45.70, nationally.31 Formula: $45.70 x 1.07 (L.A. adjustment) = $49 Mid; Low/High = $30/$90. The High accounts for larger family sizes in denser neighborhoods. (Note: These are average spends per visit, not per week. Weekly large spend visits are averaged down by smaller-item stops).
Retail ($43/$76/$97). The benchmark is the average in-store apparel transaction, informed by the businesses that generate visits in our data. In this study, Retail is overwhelmingly a garment-district phenomenon: 75% of all Retail visits fall in the downtown Los Angeles Fashion District. The stores there are independent wholesale-to-public apparel vendors. The spend rate is set to an off-price, garment-corridor transaction, expressed as a national equivalent retail range of $40 (low)/ $70 (mid) / $90 (high, multiple purchases) at retail sites. This range is consistent with industry benchmarks of national average all retail ($51) and clothing retail ($122) at non-wholesale department, apparel, and online stores.32 Formula: $40 / $70 / $90 x 1.08 (LA adjustment) = $43 / $76 / $97.
Retail Complex ($34/$59/$75). This rate applies to multi-tenant addresses (i.e., shopping alleys) coded as a single site in a broader complex. The spend estimate is benchmarked to per-visit shopping-center spending from the International Council of Shopping Centers (ICSC) and set below the standalone Retail rate.33 In retail complexes, not all visits result in purchases, so the average spend per visit is lower than standalone retail. Formula: ICSC Non-food spend average of $55 x 1.08 (LA adjustment) = $59 mid. Low/High = $34/$75 are conservative and generous researcher estimations.
Big-Box Retail ($54/$112/$162). The benchmark is the average transaction at large Big-Box retail stores, built as a visit-weighted average of the four retailers actually present in the data, each weighted by its share of big-box category visits. Only Home Depot publishes its average ticket ($89 in SEC filings).34 Costco (~$150) comes from a Costco rep describing average transactions,35 and Target figures ($50) are produced by Numerator, a consumer-purchase panel that aggregates uploaded shopper receipts into per-retailer ticket estimates.36 Lowe’s is proxied to Home Depot. These are per-transaction figures. Formula: Mid = 1.08 x Σ (blended weight x ticket) = $112. Low is Target ($54), and the High is Costco ($162), both adjusted for LA increases.
Services ($23/$43/$73). Services is the most heterogeneous category in the study. It spans businesses as different as hair and nail salons, laundromats, wireless and phone repair shops, pet groomers, print shops, USPS shipping, automobile repair, and others. These are businesses wherein a typical customer might spend a few dollars at a coin laundry, or several hundred at a wireless/phone store. No single per-visit figure can capture that range with precision. The $43 mid-point is a reasoned central estimate for a typical service visit, set below the rate for dedicated retail because the category leans toward frequent visits for lower-cost errands. The wide $23–$73 band reflects how much spending varies from one kind of service to the next. For this reason, the Services estimates warrant more caution than the other categories. The dollar figures are best read as broad-strokes approximations for the category as a whole; the actual impact at any individual business may differ considerably from the average.
Restaurants ($23/$47/$66). The benchmark is the per-person restaurant check, blending full-service and limited service restaurant tabs from Toast, a restaurant point-of-sale provider that publishes national check data; the average check per person across restaurant types is roughly $20.37 Because a dining party produces one bill while only some members carry a phone, one recorded visit corresponds to more than one diner’s meal (for example, young children rarely carry phones), so a people-per-visit factor scales the per-person check up to a per-visit figure. Formula: $20 x 1.17 (LA adjustment) x people per visit (2 at mid) = $47. Low end and high end adjust for people per ticket (low = 1 person; high = LA County household size of 2.81).
Specialty Food & Drink ($9/$15/$32).
The benchmark is the Bureau of Labor Statistics’ Consumer Expenditure analysis of snacks and nonalcoholic beverages, including locations such as coffee shops, bakeries, boba/tea shops, snack and nonalcoholic beverage locations.38 Our category also includes drinking places. BLS shows that average consumers spent roughly $13 per week in 2018. Adjusting for inflation, as well as the combination of both lower-ticket coffee/snack visits and higher-ticket bar visits, we estimate a mid-range of $15 per visit.39 The low end accounts for small coffee shop purchases, whereas the high end accounts for larger bakery purchases and/or average beverage tabs.
A.6 Data Coverage and Limitations
The analysis draws on foot traffic data for 989 businesses across multiple sectors located within a 0.5-mile buffer of nine documented enforcement sites, representing the most comprehensive available source of commercial activity data for these locations in the period immediately before and after the operations.
Several features of the data suggest that the estimates presented here understate the full economic impact of enforcement activity. Advan captures visits through a panel of opt-in mobile devices and does not represent the complete universe of businesses or all visitors to any given establishment. The dataset cannot capture mobile, temporary, or informal commercial activity — street vendors, food trucks, home-based businesses, pop-up markets, and swap meets — even though these segments of the Latino small-business economy are likely among those most directly affected by enforcement.
Additionally, mobile location data are known to underrepresent lower-income households, individuals with lower levels of educational attainment, and Latino populations.40 Any observed foot traffic patterns in this analysis therefore likely understate the true magnitude of the declines.
Appendix B: Survey and Focus Group Methods
This report draws on two complementary sources of qualitative and survey data collected from small business owners and entrepreneurs in Los Angeles County: a pre-focus group survey and nine focus group interviews completed by 75 entrepreneurs. Together, these data provide insight into how intensified immigration enforcement affected business operations, financial conditions, and wellbeing among entrepreneurs operating in immigrant and Latino communities.
Data collection took place between April and May 2026 in partnership with community-based organizations serving immigrant entrepreneurs. Focus groups were conducted primarily at Inclusive Action for the City (IAC) in Boyle Heights, with additional sessions held at Initiating Change in Our Neighborhoods Community Development Corporation (ICON CDC) in Pacoima and Managed Career Solutions (MCS) in the Harbor area.
The survey and focus groups were designed to provide complementary forms of evidence. The survey documented business characteristics and self-reported economic and operational impacts, while the focus groups provided detailed accounts of how entrepreneurs experienced and responded to immigration enforcement activity in their communities.
B.1 Participant Recruitment
Participants were recruited through partnerships with Inclusive Action for the City (IAC), Initiating Change in Our Neighborhoods Community Development Corporation (ICON CDC), and Managed Career Solutions (MCS). These organizations shared information about the study with entrepreneurs in their networks and invited interested individuals to complete an online interest form or email expressing their interest. After expressing interest, participants were contacted by the UCLA Latino Policy and Politics Institute (LPPI) research team to confirm eligibility, receive additional information about the study, complete the pre-focus group survey, and schedule a focus group session.
Eligible participants were business owners, managers, or supervisors who operated a business within Los Angeles County and were at least 18 years of age.
B.2 Pre-Focus Group Survey
Prior to participating in a focus group, respondents completed a 17-question survey administered through Qualtrics or in paper form. The survey was available in English and Spanish.
Survey questions collected information on:
- Business characteristics and sector
- Business revenues and operational conditions
- Perceived impacts of immigration enforcement
- Changes in customer activity and business operations
- Financial stress and business performance
- Emotional and mental health impacts
Survey results are used throughout the report to describe patterns among participating entrepreneurs. Because participants were not selected through a probability sample, survey findings should not be interpreted as representative of all Latino-owned or immigrant-owned businesses in Los Angeles County.
B.3 Focus Group Interviews
Nine focus groups were conducted between April and May 2026. Sessions ranged from approximately 90 to 120 minutes and included between 5 and 12 participants. Seven sessions were conducted in Spanish and two were conducted in English. Participants received a $200 gift card upon completion of both the survey and focus group.
Focus groups were facilitated by two trained moderators and explored participants’ experiences before, during, and after the June 2025 immigration enforcement surge. Discussion topics included:
- Business conditions prior to the raids
- Immediate operational and financial impacts
- Changes in customer behavior
- Employment and staffing challenges
- Business adaptations and coping strategies
- Financial strain and recovery
- Consequences to health and wellbeing
All focus groups were audio recorded and professionally transcribed. Respondent and business names reported throughout this study are pseudonyms.
B.4 Sample Characteristics
The study included 75 entrepreneurs representing a diverse cross-section of the Latino small-business economy in Los Angeles County. Participants operated businesses across both formal and informal sectors.
Formal businesses included restaurants, bakeries, retail stores, salons, barbershops, childcare providers, auto repair businesses, florists, furniture retailers, and other brick-and-mortar establishments. Informal and semi-formal businesses included street vendors, swap meet vendors, food truck operators, home-based food businesses, caterers, and self-employed service providers. Although some businesses are categorized as informal in this report, many operated with local permits and complied with applicable municipal regulations.
Approximately 75% of participants identified their business as immigrant-owned, and 92% reported that immigration enforcement activity had occurred in the community where their business operated.
Two pairs of respondents represented different operating locations of the same business enterprise. These cases were retained in qualitative analyses because they reflected distinct experiences and business contexts. For revenue-loss calculations, duplicate businesses were counted only once to avoid double counting.
B.5 Qualitative Study Limitations
This study was designed to document the experiences of entrepreneurs affected by immigration enforcement rather than to produce statistically representative estimates of all Latino-owned or immigrant-owned businesses in Los Angeles County.
Participants were recruited through community-based organizations, and entrepreneurs experiencing substantial impacts may have been more likely to participate than those reporting little or no disruption. As a result, survey percentages reported throughout the study should be interpreted as descriptive of participating entrepreneurs rather than estimates of prevalence for the broader business population.
The sample also included a larger number of women than men, likely reflecting recruitment pathways, availability, and willingness to participate in focus-group discussions.
Immigration status was not systematically collected through the survey instrument. This decision was made to reduce barriers to participation and avoid increasing respondent discomfort. References to undocumented status, DACA status, lawful permanent residency, or U.S. citizenship therefore reflect information voluntarily disclosed during focus groups and should not be interpreted as comprehensive measures of the sample.
Finally, reported business losses, debt accumulation, operational disruptions, and health impacts are based primarily on self-reported survey and focus-group data and were not independently verified. Revenue-loss estimates presented in this report should be interpreted as approximations intended to illustrate the scale of reported disruption rather than precise measures of economic loss.
Appendix C: Parameters and Assumptions for Broader Economic Estimates
Our figures are not measured estimates of actual county-wide losses, but extrapolations based on specific assumptions. Specifically, we assume a modest county-wide decline in foot traffic, set conservatively below what we observed in the outer bands of enforcement sites, and apply it to comparable business sectors across LA County to produce illustrative economic estimates.
C.1 Coverage and Scaling
A tally of businesses across the nine enforcement sites, compared against the 2023 Census Bureau County Business Patterns,41 indicates that our sample includes roughly 2.0% of all LA County retail, grocery, and other businesses that rely on foot traffic for revenue. To build the county-wide universe, we matched our business sectors to their corresponding Census industry categories and counted all such establishments in the 2023 County Business Patterns, yielding roughly 51,900 businesses, county-wide. Because the Census counts individual establishments rather than properties, businesses that our mobility data record within retail complexes appear in these counts under their own industry categories, such as retail or restaurants.
C.2 Foot Traffic and Revenue Assumptions
We apply a county-wide foot traffic decline of 1.0%, about two-thirds of the 1.63% decline observed at the outer bands of enforcement sites. We convert the assumed decline into dollars one sector at a time, in three steps. First, we take the average number of visits a business in that sector received over the two weeks before the enforcement actions, based on our sample. Second, we multiply those visits by the assumed 1.0% decline and by the sector’s average spending per visit. This gives the estimated two-week loss for a single business. Third, we multiply that loss by the number of establishments in the sector county-wide and sum across the six sectors. Monthly figures scale the two-week total to an average calendar month of 30.44 days, so the monthly estimate is slightly more than double the two-week estimate.
C.3 Economic Estimates
Using the parameters outlined above, we determine that a 1% decline in foot traffic yields estimated county-wide spending losses of roughly $52 million over two weeks and $114 million over a month. As an even more conservative alternative, applying a 0.5% decline in foot traffic (about one-third of the observed 1.63%) halves these figures, to roughly $26 million over two weeks and $57 million over a month.
C.4 Limitations
We do not observe foot traffic beyond our study sites, nor can we confirm that a decline of 0.5% or 1.0% held uniformly across the county. Moreover, our revenue figures are not observed measures; they draw on patterns observed across the nine sites and extend conservative estimates of those trends to the population of comparable Los Angeles County businesses. Finally, the uniform decline is applied to all sectors, including grocery, even though grocery foot traffic rose slightly at our study sites. This choice has a negligible effect on the totals, as grocery accounts for roughly 4% of the projected losses.
C.5 Comparison with independent estimates
Using transaction-level consumer spending and mobility data, an independent analysis estimates that ICE enforcement was associated with a 20–25% decline in consumer spending in immigrant-heavy Los Angeles County retail neighborhoods, amounting to roughly $280 million in lost sales over one month. Their findings validate the direction and significance of our estimates, offering independent confirmation that the enforcement surge produced substantial economic harm.42
End Notes
1 Los Angeles County Economic Development Corporation (LAEDC),“LAEDC Releases The Latino Report,” (press release, May 11, 2026), available online.
2 Ibid.
3 Rosario Isabel Majano, Silvia R. González, Julia Silver, Paul M. Ong, Julia Hernandez Nierenberg, Chhandara Pech, Jennifer Uribe, Juan Carlos Ruiz Malagon, and Sonja M. Diaz, Business as Usual: Entrepreneurs of Color in California Face Challenges in Technology, Climate Change, and Sustainability in a Post‑COVID Economy (Los Angeles: UCLA Latino Policy and Politics Institute, 2023), available online.
4 Ibid.
5 Silvia R. González, Paul M. Ong, and Chhandara Pech, “Impacts of the January 2025 Wildfires on Businesses: The Local Business Landscape in Altadena and Pacific Palisades Before the Wildfires” (UCLA Latino Policy and Politics Institute, University of California Los Angeles, Los Angeles, October 2025), available online; Chhandara Pech, Silvia R. González, and Paul M. Ong, “Impacts of the January 2025 Wildfires on Businesses: Six-Month Assessment in Altadena and Pacific Palisades” (UCLA Latino Policy and Politics Institute, University of California Los Angeles, Los Angeles, October 2025), available online.
6 Josh DuBose, “DHS Secretary Kristi Noem attends ICE raid at Los Angeles County home,” KTLA 5 Local News, June 12, 2025, available online; Jill Cowan and Mimi Dwyer, “Federal Agents March Through L.A. Park, Spurring Local Outrage,” The New York Times, July 7, 2025, available online.
7 Tara Watson, “Inside the Refrigerator: Immigration Enforcement and Chilling Effects in Medicaid Participation,” American Economic Journal: Economic Policy 6, no. 3 (2014) 313–338, available online; Dulce Gonzalez, Jennifer M. Haley, Hamutal Bernstein, Genevieve M. Kenney, and Michael Karpman, “Immigrant Families Disengaged from Public Life and Essential Services Because of Immigration Concerns in 2025” (Urban Institute, Washington, DC, April 2026), available online.
8 Paul M. Ong, Caylin Luebeck, Chhandara Pech, Rosario Majano, Vinna Lee, Naya Lee, and Arturo Vargas Bustamante, “Medi-Cal Enrollment Declines Amid Heightened Immigration Enforcement in California” (UCLA Latino Policy and Politics Institute, University of California Los Angeles, Los Angeles, June 2026), available online.
9 Ahmad Ismail, Arturo Vargas Bustamante, Jie Zong, and Silvia R. González, “What the United States Economy Stands to Lose: Latino Immigrant Labor in the Crosshairs” (UCLA Latino Policy and Politics Institute, University of California Los Angeles, Los Angeles, November 2025), available online.
10 Patricia Gándara and Lucrecia Santibañez, “The Impact of a Broken Immigration System on U.S. Students and Schools” (UCLA Latino Policy and Politics Institute, University of California Los Angeles, Los Angeles, December 2023), available online.
11 John Gittelsohn, “ICE Raids Derail Los Angeles Economy as Workers Go into Hiding,” Bloomberg, July 7, 2025, available online; Martín Macías Jr., “LA Restaurants Are Struggling Amid ICE Raids,” LA Public Press, July 11, 2025, available online; Jeanne Kuang and Nigel Duara, “Worksite Immigration Raids Are Supposed to Free Up Jobs for Citizens. Here’s What Really Happens,” CalMatters, July 2025, available online; Shannon M. Sedgwick, Justin Adams, Dan Wei, Max Chomas, and Matthew Skyberg, Economic Impacts of Federal Immigration Enforcement in Los Angeles County (Los Angeles: Los Angeles County Department of Economic Opportunity and LAEDC, 2026), available online.
12 Josh DuBose, “DHS Secretary Kristi Noem attends ICE raid at Los Angeles County home,” KTLA 5 Local News, June 12, 2025, available online; Jill Cowan and Mimi Dwyer, “Federal Agents March Through L.A. Park, Spurring Local Outrage,” The New York Times, July 7, 2025, available online.
13 Hamed Aleaziz and Orlando Mayorquín, “Immigration Arrests in Los Angeles Spike Amid Aggressive Enforcement,” The New York Times, July 11, 2025, available online.
14 Nathan Solis, “3 U.S. Marine Brothers Faced Toughest Mission: Getting their Dad Freed From ICE Custody,” Los Angeles Times, July 22, 2025, available online; Alicia Victoria Lozano, “Home Depots Become Prime Location For Immigration Enforcement,” NBC News, August 23, 2025, available online; Rachel Uranga and Brittny Mejia, “2 California ICE Shootings in Nine Days: Latest Confrontation Leaves Bloody Scene,” Los Angeles Times, October 30, 2025, available online.
15 Tara Watson, “Inside the Refrigerator: Immigration Enforcement and Chilling Effects in Medicaid Participation,” American Economic Journal: Economic Policy 6, no. 3 (2014): 313–338, available online; Dulce Gonzalez, Jennifer M. Haley, Hamutal Bernstein, Genevieve M. Kenney, and Michael Karpman, “Immigrant Families Disengaged from Public Life and Essential Services Because of Immigration Concerns in 2025” (Urban Institute, Washington, DC, April 2026), available online.
16 Edward Orozco Flores, Quy Lam, Keila Luna, and Todd Sorensen, “The Effects of Recent Federal Immigration Enforcement on California’s Private Sector Employment ” (UC Merced Community and Labor Center, August 2025), available online;Edward Orozco Flores, Quy Lam, and Jennifer Elena Cossyleon, “The Effects of Recent Federal Immigration Enforcement on Private Sector Employment in California and Washington, D.C.” (UC Merced Community and Labor Center, November 2025), available online.
17 Abby Raisz, Bailey Nicolson, Maria-Elena De Trinidad Young, Fabiola Perez- Lua, Sharon Tafolla, Sarina Rodriguez, and Samantha Valle Meraz, The Economic Impact of Mass Deportation in California (Bay Area Council Economic Institute and University of California, Merced, June 2025), available online.
18 Shannon M. Sedgwick, Justin Adams, Dan Wei, Max Chomas, and Matthew Skyberg, Economic Impacts of Federal Immigration Enforcement in Los Angeles County (Los Angeles: Los Angeles County Department of Economic Opportunity and LAEDC), 2026, available online; T. William Lester, Matthew Wilson, and Eli Knaap, “The ‘Chilling Effect’ of ICE Enforcement: Evidence from High-Frequency Mobility and Spending Data in the Los Angeles Region”.White paper, University of California, Irvine, January 2026, available online; Exequiel Hernández, “ICE-ing the Economy: Immigration Enforcement Under Trump 2.0 and Local Economic Activity.” (Working paper, University of Pennsylvania, Wharton School, May 2026), available online.
19 Shannon M. Sedgwick, Justin Adams, Dan Wei, Max Chomas, and Matthew Skyberg, Economic Impacts of Federal Immigration Enforcement in Los Angeles County (Los Angeles: Los Angeles County Department of Economic Opportunity and LAEDC, 2026), available online; T. William Lester, Matthew Wilson, and Eli Knaap, “The ‘Chilling Effect’ of ICE Enforcement: Evidence from High-Frequency Mobility and Spending Data in the Los Angeles Region.” (White paper, University of California, Irvine, January 2026), available online; Exequiel Hernández, “ICE-ing the Economy: Immigration Enforcement Under Trump 2.0 and Local Economic Activity.” (Working paper, University of Pennsylvania, Wharton School, May 2026), available online.
20 Luis Tadeo, “Statement from Coalition for Humane Immigrant Rights (CHIRLA) on President Trump’s Reign of Terror in Los Angeles Focused Largely on POC Latino Neighborhoods,” (press release, July 22, 2025), available online.
21 John Donegan, “National Guard Troops Remain Staged in Paramount, a City Thrust into Political Conflict,” LAist, June 10, 2025, available online.
22 Tara Watson, “Inside the Refrigerator: Immigration Enforcement and Chilling Effects in Medicaid Participation,” American Economic Journal: Economic Policy 6, vol. 3 (2014): 313–338, available online; Dulce Gonzalez, Jennifer M. Haley, Hamutal Bernstein, Genevieve M. Kenney, and Michael Karpman, “Immigrant Families Disengaged from Public Life and Essential Services Because of Immigration Concerns in 2025” (Urban Institute, Washington, DC, April 2026), available online.
23 Elly Yu and Jordan Rynning, “ICE Arrests Tripled Last Year in LA — and More Than Half of Those Arrested Had no Criminal Record,” LAist, March 31, 2026, available online. Monthly arrest figures are taken from the accompanying chart, “ICE arrests in the L.A. region spiked in June 2025 and stayed higher than previous years,” which presents LAist’s analysis of data from the Deportation Data Project, a UCLA–UC Berkeley initiative that publishes federal immigration enforcement data obtained through the Freedom of Information Act. The comparison of June 2025 arrests with those six months earlier reflects the authors’ calculation from the chart’s monthly values.
24Luis Tadeo, “Statement from Coalition for Humane Immigrant Rights (CHIRLA) on President Trump’s Reign of Terror in Los Angeles Focused Largely on POC Latino Neighborhoods,” (press release, July 22, 2025), available online.
25A number of recent studies document the economic consequences of intensified immigration enforcement. Using national data on thousands of geocoded ICE operations, Hernández (2026) finds that foot traffic and consumer spending decline sharply near enforcement sites, with effects that persist over time and appear regardless of neighborhood demographic composition. Within the Los Angeles region, Lester, Wilson, and Knaap (2026) document a 20–25% decline in consumer spending in immigrant-heavy retail neighborhoods, and the Los Angeles County Department of Economic Opportunity and Economic Development Corporation (2026) report that 82% of surveyed businesses were negatively affected by ICE raids, with more than half experiencing reduced sales. Our findings align with this work. See Exequiel Hernández, “ICE-ing the Economy: Immigration Enforcement Under Trump 2.0 and Local Economic Activity” (working paper, University of Pennsylvania, Wharton School, May 2026), available online; T. William Lester, Matthew Wilson, and Eli Knaap, “The ‘Chilling Effect’ of ICE Enforcement: Evidence from High-Frequency Mobility and Spending Data in the Los Angeles Region” (white paper, University of California, Irvine, January 2026), available online; Shannon M. Sedgwick, Justin Adams, Dan Wei, Max Chomas, and Matthew Skyberg, Economic Impacts of Federal Immigration Enforcement in Los Angeles County (Los Angeles: Los Angeles County Department of Economic Opportunity and LAEDC, 2026), available online.
26Rosario Isabel Majano, Silvia R. González, Julia Silver, Paul M. Ong, Julia Hernandez Nierenberg, Chhandara Pech, Jennifer Uribe, Juan Carlos Ruiz Malagon, and Sonja M. Diaz, Business as Usual: Entrepreneurs of Color in California Face Challenges in Technology, Climate Change, and Sustainability in a Post‑COVID Economy (Los Angeles: UCLA Latino Policy and Politics Institute, 2023), available online.
27 Silvia R. González, Paul M. Ong, and Yina Marin, “Post-Pandemic Small Business Recovery Amid Economic and Credit Headwinds” (UCLA Latino Policy and Politics Institute, University of California Los Angeles, Los Angeles, September 2025), available online.
28 Federal Deposit Insurance Corporation (FDIC), “2023 FDIC National Survey of Unbanked and Underbanked Households,” updated November 14, 2024, available online.
29 Rebekah Jones, “Enclaves of Isolation: Violence and Political Participation in U.S. Cities” (University of California, Berkeley, September 2025), available online.
30 Author’s Calculations using the U.S. Bureau of Labor Statistics, Consumer Expenditure Surveys, “Two-Year Average Tables by Metropolitan Statistical Area: Los Angeles, 2023-2024,” accessed June 2026, available online; U.S. Bureau of Economic Analysis, “MARPP Regional Price Parities by MSA: Los Angeles-Long Beach-Anaheim,” accessed June 2026, available online.Earnest Analytics, “US Clothing & Accessories Spend Drops in 2025,” accessed June 2026, available online.
31 FMI, “Food Industry Facts-In Store Transaction 2024 Data,” accessed June 2026, available online.
32 Earnest Analytics, “US Clothing & Accessories Spend Drops in 2025,” accessed June 2026, available online.
33 ICSC, “Industry Conditions: Shopping Centers: Where Americans Buy, Socialize, Play,” accessed June 2026, available online.
34 Home Depot, “The Home Depot Announces Fourth Quarter and Fiscal 2024 Results; Increases Quarterly Dividend By 2.2%; Provides Fiscal 2025 Guidance,” February 25, 2025, available online.
35 Michael Bartiromo, “How Much Does the Average Costco Shopper Spend Per Visit? Costco Reveals the Answer,” The Hill, March 26, 2023, available online.
36 Dominick Reuter, “Meet the Typical Target Shopper, a Millennial Suburban Mom With a Household Income of $80,000,” Yahoo! News, February 4, 2023, available online.
37 Toast, “Toast Restaurant Trends Report: The Cost of Going Out to Lunch,” updated September 10, 2024, available online.
38 Geoffrey D. Paulin, “Meal Appeal: Patterns of Expenditures on Food away from Home” (U.S. Bureau of Labor Statistics, April 2020), available online.
39 Ibid.; Toast, “Coffee and Tea Trends in all 50 States, New Restaurant Wage Data, and Breakfast Performance,” updated June 6, 2024, available online.
40 Zhenlong Li, Huan Ning, Fengrui Jing, and M. Naser Lessani, “Understanding the Bias of Mobile Location Data Across Spatial Scales and Over Time: A Comprehensive Analysis of SafeGraph Data in the United States,” PLoS ONE 19, no. 1 (2024), available online.
41 U.S. Census Bureau, “2023 Census Bureau County Business Patterns”, accessed June 2026, available online.
42 T.William Lester, Matthew Wilson, and Eli Knaap, “The ‘Chilling Effect’ of ICE Enforcement: Evidence from High-Frequency Mobility and Spending Data in the Los Angeles Region” (white paper, University of California, Irvine, January 2026), available online.
Acknowledgements
The UCLA Latino Policy and Politics Institute (LPPI) and Inclusive Action for the City (IAC) gratefully acknowledge the California Wellness Foundation, the Latino Community Foundation, and the Evelyn and Walter Haas Jr. Fund for their early investment in this research and the broader vision it represents. UCLA LPPI further acknowledges the California Latino Legislative Caucus and The James Irvine Foundation for general operating support that sustains the Institute’s work.
At IAC, we are grateful to Rudy Espinoza, Doug Smith, Norma Santa Cruz, Julie Jung, Selena Casas, and Isabella Elizalde for their collaboration throughout the project, including participant outreach, small business engagement, and coordination of focus group interviews. Their partnership and deep relationships with Los Angeles’ small business community were essential to this research.
We also appreciate the support of Initiating Change in Our Neighborhoods Community Development Corporation (ICON CDC), especially Elizabeth Padilla and Cindy Munoz, and the Managed Career Solutions–Harbor BusinessSource Center team, including Avilio Rubio, Luis Luna, Robert Paz, and Jessica Acevedo, for their assistance with small business outreach and focus group coordination.
The authors thank LPPI fellows Yina Marin, Jasmine Ostorga, Ana Lua Martel, Jonathan Ramos, Bianca Diezmo, Yvette Mendez, Yailine Velazquez Delgado, and Natalie Gonzalez, whose research support at various stages was instrumental to the completion of this project. Thank you to Adriana Perez for assistance with design and layout. We also recognize LPPI staff: Julia Silver provided assistance with survey programming; Steven Acosta, Lorena Roberts, and Ana Guzman supported grant administration and project logistics; and Lila Burgos provided research and management support throughout this project.
Key scholars provided valuable feedback. We thank Manuel Pastor for his encouragement and invitation to present preliminary findings, Greg Wright for reviewing the report’s quantitative analyses, and Katherine Maldonado and Mayra Puente for reviewing the qualitative analyses.
Finally, we extend our deepest gratitude to the business owners and entrepreneurs who shared their experiences with us. Their time, insights, and participation made this research possible.
The UCLA Latino Policy and Politics Institute acknowledges the Gabrielino and Tongva peoples as the traditional land caretakers of Tovaangar (the Los Angeles basin and Southern Channel Islands) and recognizes that their displacement has enabled UCLA’s flourishing. As a land-grant institution, we pay our respects to the Honuukvetam (Ancestors), Ahiihirom (Elders), and Eyoohiinken (our relative nations), past, present, and emerging.
Disclaimer
The views expressed herein are those of the authors and not necessarily those of the University of California, Los Angeles as a whole. The authors used generative AI to support copyediting, proofreading, and internal consistency and style checks, not to generate or alter data, analysis, interpretations, or conclusions. The authors alone are responsible for the content of this report.
For More Information
Contact: lppipress@luskin.ucla.edu
© July 2026 by the Regents of the University of California, Los Angeles. All rights reserved. Printed in the United States.