


From Disparity to Parity: Latino Representation in Appointed Positions within California’s Gubernatorial Cabinet, State Boards, and Commissions
Executive Summary
Appointed positions in state governing boards, commissions, and departments play a critical role in advising the state administration, establishing statewide public policy priorities and regulatory standards, and determining the allocation of billions of dollars in state funds and public resources. This report analyzes the representation of Latinos in such appointed positions across California’s executive branch, which includes 482 appointments to the governor’s cabinet leadership and influential state boards and commissions. California stands as the fifth-largest economy in the world, and its future prosperity is inextricably linked to the well-being of the state’s growing and diverse Latino population. Therefore, the underrepresentation of Latinos in executive branch appointments has severe repercussions for the future of the state’s civic engagement, public trust, and equitable policy development, from the regulation of environmental and educational standards to the implementation of workforce development strategies and criminal justice reform. While the report focuses on Latino representation, this analysis aims to ensure that California’s government is both representative and reflective of the broad racial, ethnic, gender, sexual orientation, age, and geographic diversity that continues to drive the state’s population growth, political power, and economic dynamism.
Our analysis of the demographic trends of California’s state-level appointments found that as of March 15, 2022:
- Latinos have the largest representation gap among all racial and ethnic groups in California’s executive appointees.
- Despite making up 39.1% of the state population, Latinos are only 18.4% of executive appointees, meaning they are underrepresented in executive appointments by 20.7 percentage points.
- In comparison, non-Hispanic whites are overrepresented by 12.3 percentage points—they make up 36.5% of the state population but 48.8% of all executive appointments.
- Among all women, Latinas remain the most underrepresented in executive branch appointments.
- Latinas make up 19.4% of the state’s population but are only 8.5% of all executive appointments (a representation gap of 10.9 percentage points). Latinas are 19% of all women executive appointments, making them the second-largest share of appointed women in the executive branch.
- In comparison, non-Hispanic white women are overrepresented. They make up 18.3% of the state’s population, and 19.1% of all executive appointments, but 42.5% of all women appointments.
- Despite Latinos’ long history in California, Latinos tend to be more recent appointments to the executive branch and were predominantly appointed under the Newsom administration.
- 70.7% of Latino appointees were appointed in just the last four years (2019 – 2022).
- In comparison, non-Hispanic white appointees are more likely to be legacy appointments that were carried over from a previous administration. 42.7% of non-Hispanic white appointments were made in the last four years, meaning that over 57% were appointed before 2019.
- Latino underrepresentation in executive boards and commissions leads to the absence of Latino voices at key regulatory and agenda-setting tables.
- Latinos would need to make up at least 39.1% of these boards and commissions to meet proportional representation. However:
- Latinos make up only 14.6% of appointed positions that regulate the environment. This is particularly troubling given that Latinos are disproportionately impacted by the health and economic threats of climate change, including the state’s highest levels of environmental pollution and climate-induced job losses.
- Latinos represent 27.7% of appointed positions on educational boards and commissions, despite making up a disproportionate share of the student population for which these boards set policy. As of 2020, Latinos make up over 55% of California’s K-12 public school population and 43% of its state-funded higher education system.
- Latinos are only 20% of appointed positions on workforce development and economic opportunity boards and commissions but continue to play a significant role in driving the state’s labor force growth and job creation.
- Latinos hold only 10.3% of appointed positions on criminal justice boards and commissions, even though Latinos make up over 40% of the jail and prison population in California and Latino youth are 65% more likely than white youth to encounter the justice system.
- Latinos would need to make up at least 39.1% of these boards and commissions to meet proportional representation. However:
- Undefined term limits and reappointments favor the retention of non-Hispanic white commission and board members.
- Of the reappointments tracked by UCLA LPPI, 63.1% were non-Hispanic white. Comparatively, Latinos make up only 7.8% of reappointments to board and commissions.
- Additionally, non-Hispanic whites comprise 52.4% of board and commission members who serve without term limits. They have no stated end-of-term dates for their appointments and may therefore bypass the need for a reappointment.
- The underrepresentation of Latino appointments in executive boards and commissions correlates to an underrepresentation of Central and Southern Californian voices.
- Central and Southern California are home to 71.3% of the state’s population and 83.4% of the state’s Latinos, and the absence of their voice in developing strategy, regulations, and policy priorities for the future of California’s environment, education, economy, and criminal justice systems perpetuates historical regional inequities across our state.
Based on these findings, we recommend the following:
- Pass California Senate Bill 1387, which would direct the governor’s Office to build internal capacity to track and report the demographic makeup of gubernatorial appointments.
- Issue an executive order that sets state government-wide directives for reaching proportional representation, ensuring that appointments better reflect the state’s diverse constituencies across race and ethnicity, age, gender, sexual orientation, geographic residence, and more. These representational standards should be set at an individual entity level (e.g, for a board, commission, or department) to ensure that all voices are heard at every decision-making table.
- The governor’s office should direct the state’s appointments team to review the bylaws and statutes of executive commissions and boards to ensure that all appointments have appropriate terms and defined term limits. Doing so would create a regular stream of openings on key boards and commissions where diverse candidates could be recruited and appointed.
- The governor’s office should limit the practice of granting legacy reappointments to boards and commissions. Instead, the administration can leverage term limits and position openings as opportunities to appoint new candidates who can introduce additional perspectives and better represent California’s increasingly diverse constituencies.

Introduction
California’s executive branch consists of more than 3,000 appointments. While eligibility, qualifications, and responsibilities for appointments may vary,1 all appointees share the overarching responsibility of representing the diverse ethnic backgrounds, community experiences, and professional expertise of California’s population. Many studies have shown the crucial role that such descriptive representation and participation can play in building public trust in governing institutions, fostering civic participation,2 and improving government responsiveness to the needs of its diverse constituents.3 California stands as one of the most racially diverse states in the country4 and, since 2014, has had a Latino plurality that surpasses all other racial and ethnic groups (39.1% of the state’s population).5
This report analyzes the demographic representation of key positions across California’s executive branch appointments, consisting of 482 appointees within 1) the governor’s leadership cabinet and 2) executive boards and commissions. Appointing power in the executive branch is shared by the governor, the speaker of the state Assembly, the state’s Senate president pro tempore, and a handful of state and local officials vested with the authority to appoint representatives to specific entities (e.g, county supervisor, city councils, and topic-relevant state officials). As of March 2022, presiding Governor Gavin Newsom has appointed 55.3% of the executive branch appointments tracked by UCLA LPPI, his gubernatorial predecessors made 21.1%6 of these appointments, and the remaining 23.6% have been made by state legislators, and other state and local officials.7
The governor’s leadership cabinet serves as an advisory council to the governor and is made up of 25 secretaries and undersecretaries, who together head California’s 11 major departments and agencies.8 Secretaries and undersecretaries are appointed solely by the presiding governor and are authorized to serve through the end of that governor’s term in office. Gubernatorial authority over cabinet appointments allows presiding governors to expand their influence and ensure their agenda is implemented across varying levels of state bureaucracy.
Executive boards and commissions include 45 authorized bodies that operate within the state’s major departments and agencies and, in some instances, also serve as stand-alone agencies.9 These boards and commissions consist of 457 appointed seats,10 which include leadership roles (e.g., chairs and vice chairs), general members (e.g., commissioners and board members), and students (e.g., student representatives/members).11 The topics covered by commissions and boards range from professional licensing and environmental protection to public safety and K-12 educational standards. Their responsibilities include drafting regulations, reviewing appeals, supervising policy implementation, and allocating resources. Appointing power over boards and commissions is shared by the governor, the speaker of the state Assembly, the state’s Senate president pro tempore, and a handful of state and local officials,12 although the governor is responsible for a majority of the appointments. Board and commission appointment terms are defined individually by the entities’ bylaws and statutes.
Data and Methodology
To identify and analyze the demographic composition of California’s executive branch appointments, we use the publicly available rosters and staff lists on the state’s department, commission, and board websites. For each appointed individual, we relied on publicly available information provided by Governor Gavin Newsom’s newsroom,13 the governor’s appointments index,14 and media/news sources to identify information on appointments. For every appointment, we track the appointee’s name, gender, race/ethnicity, educational degrees, and place of residence at the time of appointment, as well as details on their appointment: the appointing entity (e.g., governor, legislator, or other state/local agency), appointment position, appointment date, reappointments, and end of term.
For this analysis, all executive appointees were assigned a race and ethnic group defined by U.S. Census Bureau, American Community Survey.15 An appointee’s race and ethnicity were identified through a multistep process:
- Self-identification: If available, we used the appointee’s own public self-identification with a racial group to place them into a racial/ethnic group. Self-identification sources included biographies and public profiles.
- Third-party identification: If an individual’s biographies or profiles did not explicitly self-identify race/ethnicity, we sourced public news articles, features, awards, and other public-facing materials that identified an appointee by a specific racial group (e.g., an article featuring them as the first African American to hold their position.)
- Census surname probability: For all individuals, we used the U.S. Census Bureau’s 2010 Census Surname to impute the likelihood that an individual belongs to a particular racial and/or ethnic group based on their last name. The U.S. Census Bureau’s surname table includes the probability that a surname is of a specified racial/ethnic group. A racial group was assigned to individuals if their surname had a 50% or greater likelihood of being a select racial/ethnic group. Self-identification and third-party identification took precedence over the census’s racial identification and overrode census racial identification if they did not match.
Findings

Latinos represent 39.1% of Californians and have been the largest ethnic group in the state since 2014. Yet, they remain historically underrepresented in the state’s executive government. Table 1 provides an overview of Latino representation across all executive branch appointments tracked by UCLA LPPI (482 appointments), which consists of the governor’s cabinet (25 appointments) and key executive boards and commissions (457 appointments). As of March 15, 2022, 445 of the 482 appointments within the executive branch have been filled, leaving 37 vacancies.
Latinos should make up at least 39.1% of California’s executive appointments to meet proportional representation, which means that 174 of the 445 currently filled executive appointments should be Latino. However, as shown in Table 1, Latinos make up only 18.4% of executive appointments (82 of 445 appointments). Latinas, in particular, are only 8.5% of executive appointments (38 of 445 appointments), despite making up 19.4% of the state’s population.16 To achieve proportional representation, the respective appointing powers, including the governor, state legislators, and other state/local entities, must add at least 92 more Latinos to the governor’s cabinet and state executive commissions.
Table 1: Latino share of California’s executive branch appointments (March 15, 2022)
(The governor’s executive cabinet and state executive boards and commissions)
Source: UCLA LPPI analysis of the demographic composition of 445 executive appointments, as of March 15, 2022.
1. Latinos have the largest representational gap among all racial and ethnic groups in California’s executive appointees.
Figure 1 compares the racial composition of executive appointments to the racial demographics of California. The two most underrepresented populations in executive appointments are Latinos and Asian Americans and Pacific Islanders (AAPI). Despite making up nearly 54% of the state collectively, only 26% of executive appointments are Latino or AAPI. Latinos, in particular, remain the most underrepresented. Despite making up 39.1% of the state population, Latinos are only 18.4% of executive appointees, meaning they are underrepresented in executive appointments by 20.7 percentage points. In comparison, the non-Hispanic white population is overrepresented by 12.3 percentage points. They are 36.5% of the state’s population but 48.8% of all executive appointees.
Figure 1: Race and ethnic composition of executive branch appointees compared to the California population, March 15, 2022
Source: UCLA LPPI analysis of the demographic composition of 445 executive appointments, as of March 15, 2022; 2016-20 5-year American Community Survey public use microdata.
Notes: Appointment demographic shares do not add up to 100% due to double counting. Three appointees self-identified as Afro-Latino and are double counted as Black and Latino. One appointee self-identified as both Chicana and a member of the Cherokee Nation and is double counted as both Latino and American Indian/Alaskan Native. Additionally, UCLA LPPI could not confirm the race and ethnicity of 64 (14.4%) of the 445 executive appointments; they were identified as unknown and removed from this analysis.
2. Latinas make up 19% of female appointees but only 8.5% of total executive appointees.
Figure 2 compares the racial composition of women executive appointees to their share of California’s population. Women are underrepresented in executive appointments by over five percentage points: They make up 50.3% of California’s population but only 44.9% of all appointees (200 of 445 executive appointments). Among all women, Latinas remain the most underrepresented in executive branch appointees. Latinas are almost proportionally represented among women executive appointments. Latinas make up 19.4% of the state’s population and 19.0% of all female executive appointees, making them the second-largest share of appointed females in the executive branch. However, Latinas make up only 8.5% of all executive appointees, an underrepresentation of 10.9 percentage points. In comparison, non-Hispanic white women, who make up 18.3% of the state’s population, are overrepresented in executive appointments. They make up 19.1% of all executive appointees and 42.5% of all women appointees.
Figure 2: Racial and ethnic composition of woman executive branch appointees compared to California women, March 15, 2022
Source: UCLA LPPI analysis of the demographic composition of 200 women executive appointees, as of March 15, 2022; 2016-20 5-year American Community Survey public use microdata.
Notes: Appointment shares do not add up to 100% due to double counting. Two appointees self-identified as Afro-Latina and are double counted as both Black and Latina. One appointee self-identified as both Chicana and a member of the Cherokee Nation and is double counted as both Latina and American Indian/Alaskan Native. Additionally, UCLA LPPI could not confirm the race and ethnicity of 35 of the 200 women executive appointees analyzed (17.5%). They were identified as unknown and removed from this analysis.
3. Latinos tend to be more recent appointees to the executive branch, with 70.7% of Latino appointments made in just the last four years (2019–22).
A significant share of the initial appointments of executive boards and commissions were made between 2019 and 2022. Figure 3 provides a breakdown of initial appointment dates before and after 2019, for 428 out of the 445 appointment dates tracked by UCLA LPPI. An initial appointment date refers to when the appointee started their current position in the executive branch. UCLA LPPI could not find the initial appointment date for 17 appointments,17 so they were removed from this analysis. As seen in Figure 3, 51.6% of all initial appointments (221 out of 428 appointments) were made in just the last four years, between 2019 and 2022. During this time, Governor Newsom was responsible for 78.7% of initial appointment dates, or 174 out of 221 new appointments.
Figure 3: Initial appointment dates for executive commission and board appointments (before and after 2019), as of March 15, 2022

* Other appointing entities includes, the speaker of the state Assembly, the state’s Senate president pro tempore, and a handful of state and local officials vested with the authority to appoint representatives to specific entities (e.g., county supervisor, city councils, and topic-relevant state officials.)
Source: UCLA LPPI analysis of the demographic composition of 428 out of the 445 executive appointments as of March 15, 2022.
Notes: Appointer shares do not add up to 100%, due to rounding.
Between 2019 and 2022, racial minorities, particularly Latinos, saw significant representational gains. Figure 4 provides a timeline for the initial appointment dates of 428 out of the 445 current executive appointees by race and ethnicity. 70.7% of all currently seated Latinos (53 out of 75 initial Latino appointments analyzed) were appointed to the executive branch between 2019 and 2022. This means that Latinos are more likely to be recent appointees among executive appointments. In fact, only 29.3% of Latino appointments (22 out of 75 initial Latino appointments analyzed) have held their position for more than four years. In comparison, non-Hispanic white appointees are more likely to be legacy appointees, with 42.7% of non-Hispanic white appointments (90 of 211 initial non-Hispanic white appointments analyzed) made in the last four years, which means that over 57% were appointed before 2019. Non-Hispanic whites make up 58.4% of appointees with more than four years of experience in the executive branch (121 of 207 appointees seated before 2019).
Figure 4: Initial appointment dates of 428 current executive appointees, by race and ethnicity, March 15, 2022
*Other includes appointees identified as Asian American Pacific Islander (AAPI), Black, American Indian/Native Alaskan, and unknown.
Source: UCLA LPPI analysis of the demographic composition of 428 of the 445 executive appointments as of March 15, 2022. A total of 17 appointments were removed because no definite appointment date could be found for their current term. All 17 were appointed by legislators and other state and local government appointing powers and did not have public announcements about their appointment.
Note: Two appointees are Afro-Latino and are double counted as both Black and Latino. Additionally, one appointee was identified as both Chicana and Cherokee and is double counted as both Latino and Native American/Indigenous.

The governor’s cabinet is composed of 11 major departments and agencies within the executive administration. UCLA LPPI has tracked the governor’s appointees for secretaries and undersecretaries of the 11 major departments and agencies for which Governor Newsom has sole appointing authority. As of March 2022, he has filled all 25 appointments, meaning there are no vacancies in the cabinet. (See Table A1 in the appendix for an overview of all the departments, agencies, and respective secretaries and undersecretaries that UCLA LPPI analyzed for this report).
1. Latinos, alongside AAPI and American Indian/Alaska Native residents, are underrepresented in the governor’s cabinet.
As shown in Figure 5, 60% of Governor Newsom’s cabinet (15 out of 25) are non-Hispanic white. Latinos, AAPI, and American Indian/Alaska Native remain underrepresented. Currently, no secretary or undersecretary was identified as American Indian/Alaskan Native. Latinos are the second most underrepresented racial and ethnic minority, making up only 12% of the governor’s cabinet (3 of 25). Latinos must make up 39.1% of these appointees to meet proportional representation, meaning that at least 10 of the 25 cabinet appointees should be Latino.
Figure 5: Racial and ethnic composition of governor’s cabinet appointees, compared to the California population, March 15, 2022
Source: UCLA LPPI analysis of the demographic composition of 25 cabinet appointees, as of March 15, 2022; 2016-20 5-year American Community Survey public use microdata.
Note: UCLA LPPI could not confirm the race and ethnicity of three of the 25 appointees analyzed, or 12% of all analyzed cabinet appointees. They were identified as unknown and removed from this analysis.
2. Women are slightly over-represented in the governor’s cabinet, making up 60% of appointees, despite making up 50.3% of the state’s population. However, Latinas remain severely underrepresented, making up only 8% of appointed cabinet positions.
Figure 6 outlines the racial and ethnic composition of women secretaries and undersecretaries in Governor Newsom’s cabinet. As of March 2022, 60% of the governor’s cabinet are women (15 of 25 cabinet appointments). Among women, Latinas are the most underrepresented. Despite making up 19.4% of the state’s population, Latinas make up only 8% of the governor’s cabinet (2 of 25 women appointees). For proportional representation, at least five of 25 of the governor’s cabinet members should be Latina, meaning that the governor should appoint at least three more Latinas.
Figure 6: Racial and ethnic composition of women cabinet appointees, compared to California women, March 15, 2022
Source: UCLA LPPI analysis of the demographic composition of 15 of 25 women cabinet appointees, as of March 15, 2022; 2016-20 5-year American Community Survey public use microdata.
Note: UCLA LPPI could not confirm the race and ethnicity of three (20%) of the 15 women appointees analyzed; they were identified as unknown and removed from this analysis.

For this analysis, executive boards and commissions consist of 45 governing entities across the 11 departments and agencies that operate the governor’s cabinet. As of March 2022, 420 of the 457 executive commission appointments have been filled, leaving 37 vacancies. Unlike cabinet appointments, which the presiding governor solely appoints, board and commission appointments are made by present and past governors, state legislators, and other state/local entities. (See table A2 in the appendix for an overview of all the executive boards and commissions tracked by UCLA LPPI).
1. Latinos have the largest representational gap among all racial and ethnic minority groups in executive boards and commissions.
To meet proportional representation, 39.1% of executive commission appointees should be Latino (164 of the 420 active executive commission appointments). However, as shown in figure 7, only 18.8% of executive commission appointees to date are Latino (79 of 420). The respective appointing powers must add at least 85 Latinos to executive boards and commissions to achieve proportional representation.
Figure 7: Racial and ethnic composition of executive commission appointees, compared to the Californian population, March 15, 2022
Source: UCLA LPPI analysis of the demographic composition of 420 executive commission appointees, as of March 15, 2022; 2016-20 5-year American Community Survey public use microdata.
Note: Appointment shares do not add up to 100% due to double counting. Three appointees self-identified as Afro-Latina and are double counted as both Black and Latina. One appointee self-identified as both Chicana and a member of the Cherokee Nation and is double counted as both Latina and American Indian/Alaskan Native. Additionally, UCLA LPPI could not confirm the race and ethnicity of 61 (14.5%) of the 420 executive board and commission appointees analyzed; they were identified as unknown and removed from this analysis.
2. Reappointments and undefined term limits favor the retention of non-Hispanic white commission and board appointees. Non-Hispanic whites make up 63.1% of reappointments.
Figure 8 breaks down the share of executive boards and commissions that have term limits and are therefore subject to a reappointment process. As of March 2022, 37 out of the 45 executive boards and commissions tracked by UCLA LPPI (347 of 457 appointments) have bylaws and statutes that outline appointment terms and eligibility for reappointment.18 The remaining eight executive boards and commissions (110 out of 457 appointments) have no term limits and are therefore not subjected to a reappointment. Instead, these 110 appointees serve at the leisure of the entity that appointed them. (See Table A3 in the appendix for a list of the 45 executive boards and commissions tracked by UCLA LPPI, by reappointments and term limits).
Figure 8: Executive board and commission appointees with appointment term limits and a reappointment process, March 15, 2022
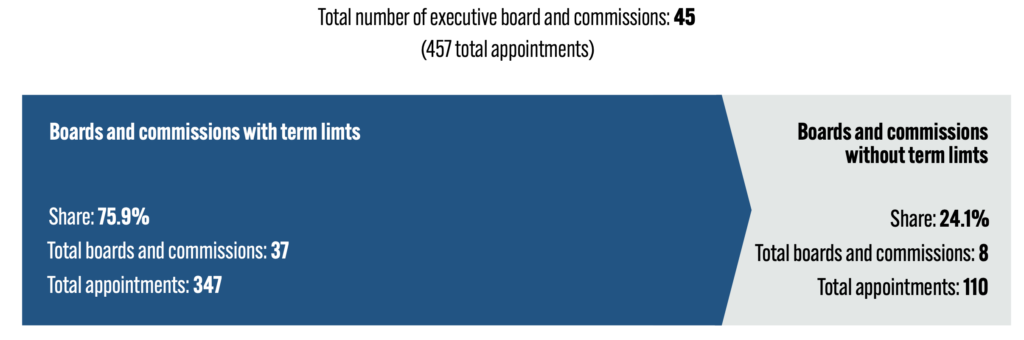
Source: UCLA LPPI analysis of the bylaws and statutes of the 45 executive boards and commissions tracked for this analysis.

If we look closely at the 347 executive boards and commission appointees subject to reappointment, we see that the reappointment process has favored the retention of non-Hispanic whites. The oversaturation of any racial group in reappointments maintains the representational status quo, making it difficult for the state’s governing boards and commissions to reflect and keep up with the population’s continuously shifting demographics. As of March 15, 2022, 317 of these 347 executive board and commission appointments were filled, leaving 30 vacancies. Table 2 outlines the number of reappointments held by these 317 seated executive commissioners and board appointees. 67.5% of board and commission appointees are currently serving their first appointment (214 of 317 executive appointees). The remaining 32.5% of these boards and commission appointees have been reappointed at least once (103 out of 317 executive appointees). Figure 9 provides the share of reappointments by the race and ethnicity of board and commission members. Non-Hispanic whites make up a disproportionate share of reappointed board and commission appointees. 63.1% of these reappointments were non-Hispanic white (65 of 103 executive reappointments); comparatively, Latinos make up only 10.7% of appointees on their second appointment (8 out of 75), but 7.8% of all reappointments (8 out of all 103 executive reappointments).
Table 2: Number of reappointments for every commission and board appointee, March 15, 2022
Source: UCLA LPPI analysis of 317 executive board and commission appointments.
Figure 9: Share of commission and board appointees with reappointments, by race and ethnicity, March 15, 2022
Source: UCLA LPPI analysis of 317 executive board and commission appointments.
Note: One appointee is Afro-Latino and is double counted as both Black and Latino, and another commissioner self-identified as both Latino and Native American and so is double counted as both Native American and Latino. Additionally, UCLA LPPI could not confirm the race and ethnicity of 45 (14.2%) of the 317 executive board and commission appointees analyzed; they were identified as unknown and removed from this analysis.

In reviewing the 110 executive boards and commission appointees without term limits, we see that the practice of undefined term limits has also played a significant role in retaining non-Hispanic white commissioners. As of March 2022, 103 of these 110 executive board and commission appointments were filled, leaving seven vacancies. Figure 10 outlines the demographic composition of these 103 seated executive board and commission appointees. Figure 10 outlines the demographic composition of these 103 seated executive board and commission appointees. They have no stated end-of-term dates for their appointments and therefore bypass the need for a reappointment. Instead, these 103 appointees serve at the pleasure of the governor and other appointing entities. Non-Hispanic white commissioners make up a disproportionate share of these undisturbed appointees, representing 52.4% of board and commission members (54 out of 103 appointees) who can serve without term limits. Non-Hispanic white appointments far exceed all other racial and ethnic groups in these appointments. Latinos are the second-largest group, but only make up 14.6% of appointees with no term limits (15 out of 103 appointees).
Figure 10: Share of board and commission appointees without term limits, by race and ethnicity, March 15, 2022
Source: UCLA LPPI analysis of the demographic composition of 103 seated executive board and commission appointees with no stated end-of-term dates for their appointments.
Note: Appointment shares do not add up to 100% due to double counting. Two appointees are Afro-Latino and are double counted as both Black and Latino. Additionally, UCLA LPPI could not confirm the race and ethnicity of 16 (15.5%) of the 103 appointees analyzed; they were identified as unknown and removed from this analysis.
3. Racial and ethnic minorities are significantly underrepresented in executive boards and commissions responsible for overseeing environmental resources and regulations.
Of the 45 executive boards and commissions tracked by UCLA LPPI, 16 oversee environmental resources and regulation in California. These 16 environmental boards and commissions consist of 161 appointments. As of March 2022, 144 of these 161 appointments were filled, leaving 17 vacancies in environmental commissions and boards. (See table A4 in the appendix for an overview of all the environmental boards and commissions tracked by UCLA LPPI).
The Latino community has been disproportionately impacted by the health and economic threats of climate change, experiencing some of the highest levels of environmental pollution and suffering the greatest threats of climate-induced job losses due to their overrepresentation in particularly vulnerable industries, such as agriculture and construction.19 As California pioneers a more climate-sustainable economy, there should be a concerted effort to protect Latinos from health hazards and prioritize them in transitioning into a more sustainable and green workforce.
Despite the disproportionate impact climate change has had on Latinos, they remain underrepresented on commissions and boards that oversee and set the agenda for environmental regulation and resources. Figure 11 outlines the racial and ethnic composition of all environmental board and commission appointees. Latinos need to make up 39.1% of environmental commission appointees to meet proportional representation, which means that roughly 57 of the 144 active environmentally related executive commission and board appointees should be Latino. However, only 14.6% of these appointees are Latino (21 of 144). The respective appointing powers, including the governor, state legislators, and other state/local entities, must add at least 36 more Latinos to achieve proportional representation.
Figure 11: Environmental commission appointees, by race/ethnicity and gender, March 15, 2022
Source: UCLA LPPI analysis of the demographic composition of 144 environmental boards/commission appointees, as of March 15, 2022.
Note: Appointment shares do not add up to 100% due to double counting and rounding. One appointment self-identified as Afro-Latina and is double counted as both Black and Latina. Due to rounding, men and women percentages do not add up to total race/ethnic shares. Additionally, UCLA LPPI could not confirm the race and ethnicity of 21 (14.6%) of the 144 appointees analyzed.

As environmental board and commission members, these appointees also hold the crucial responsibility of representing their community’s unique environmental health needs. However, environmental boards and commissions lack geographic diversity. Figure 12 shows where environmental board and commission appointees reside compared to the size of the regional population they represent. In examining the proportional breakdown, it is clear that the state’s northern metropolitan areas are significantly overrepresented on environmental boards and commissions. The Bay Area and the Greater Sacramento region collectively make up 25.8% of the state’s population, yet 59% of environmental board and commissioners reside in and represent the region (85 of 144 appointments), an overrepresentation of 33.2 percentage points. Los Angeles and the Inland Empire, on the other hand, a region that is home to 47.4% of the state’s population and 56.3% of all Latinos in California, make up only 20.1% of environmental appointees (29 of the 144 appointees). The Los Angeles and Inland Empire are therefore underrepresented in environmental boards and commissions by 27.3 percentage points.
Figure 12: Geographic representation of environmental board and commission appointees, compared to the geographic composition of all California residents and Latino residents, March 15, 2022
Source: UCLA LPPI analysis of the demographic composition and geographic residence of 144 environmental board and commission appointees, as of March 15, 2022; 2016-20 5-year American Community Survey public use microdata.
Note: See Table A8 in the appendix for geographic definitions for the California regions mentioned in the chart above.
4. Executive boards and commissions responsible for overseeing California’s education system have the best racial representation, but Latinos remain underrepresented.
Of the 45 executive boards and commissions tracked by UCLA LPPI, six boards and commissions (90 of 420 executive commission appointments) have oversight of educational policy and standards in California. As of March 2022, 83 of these appointments were filled, leaving seven vacancies. (See Table A5 in the appendix for an overview of all the education-related boards and commissions tracked by UCLA LPPI.)
Latinos make up most of California’s student population, so closing persistent opportunity gaps among Latinos could help significantly address educational inequities across the state. As of the 2022 school year, Latino youth make up over 55% of California’s K-12 public schools20 and 43% of its state-funded higher education student population.21 Due to historical disadvantages, Latinos in California continue to hold lower levels of educational attainment compared to the state average and Latinos nationally. As of 2019, 35% of Latinos in California did not complete high school, compared to just 17% of the state overall and 30% of U.S. Latinos.22 This has downstream effects on higher educational attainment and credentials. Latino men, compared to all other racial and ethnic groups, have the lowest level of higher educational attainment. As of 2019, 17% of Latino men had an associate’s degree, compared to 61% of AAPI men and 53% of non-Hispanic white men.23
To meet proportional representation, Latinos need to make up 39.1% of education-related appointments, which means that at least 33 of the 83 active education commission appointees should be Latino. However, as shown in Figure 13, only 27.7% of educational board members and commissioners are Latino (23 of 83 appointees). Moreover, five of the 23 Latino appointments are student members, who serve for shorter terms and are typically non-voting members.24 The respective appointing powers, including the governor, state legislators, and other state/local entities, must add at least 10 Latinos to achieve proportional representation.
Figure 13: Educational commission appointees, by race/ethnicity and gender, March 15, 2022
Source: UCLA LPPI analysis of the demographic composition of 83 educational boards and commission appointees, as of March 15, 2022.
Note: Appointment shares do not add up to 100% due to double counting and rounding. One appointee self-identified as Chicana and a member of the Cherokee Nation and is double counted as Latina and American Indian/Alaskan Native. Due to rounding, men and women percentages do not add up to total race/ethnic shares. Additionally, UCLA LPPI could not confirm the race and ethnicity of 10 (12%) of the 83 appointees analyzed.
Moreover, the underrepresentation of Latinos on educational boards and commissions correlates to underrepresentation in geographic diversity. Figure 14 shows where educational board members reside compared to the size of the regional population they represent. Of all the seven major regions of California, the Inland Empire and Central California, which are collectively home to 26.7% of the population and 34.2% of the state’s Latinos, remain the most underrepresented on educational boards and commissions. The Inland Empire is home to 11.7% of the state’s population, yet only 8.4% of educational appointees come from the region (7 of 83 appointees), an underrepresentation of 3.3 percentage points. The Inland Empire’s student population (children ages 5–18) is 65% Latino and, due to a history of underinvestment, have less access to early childhood education, endure higher rates of suspension, and see lower college enrollment rates than other regions of the state.25 Central California similarly makes up only 10.8% of appointees (9 of 83 appointees), although the region is home to 15% of the state’s population and has historically produced the lowest test scores and college readiness rates among students in the state due to a similar legacy of underinvestment.26
Figure 14: Geographic representation of educational board and commission appointees, compared to the geographic composition of all California residents and Latino residents, March 15, 2022
Source: UCLA LPPI analysis of the demographic composition and geographic residence of 83 educational board and commission appointees, as of March 15, 2022; 2016-20 5-year American Community Survey public use microdata.
Note: See Table A8 in the appendix for geographic definitions for the California regions mentioned in the chart above.

In addition to addressing much-needed demographic representation, Latino appointees are more likely to have direct experience with California’s public college and university systems. Figure 15 breaks down the educational attainment of the appointed members of educational commissions and boards. Latinos, specifically Latinas, are more likely than other ethnic groups to hold a degree from a CSU, UC, or other state-funded university. In total, 69.6% of Latinos on educational boards and commissions (16 of 23 appointees) have direct experience in California’s public college and university system and hold degrees from community colleges, CSUs, and/or UCs and California state-funded universities.27 According to the California State University, Latinos make up nearly 50% of the CSU student body, and 62% of California’s Latino graduates have earned their bachelor’s degree from CSU.28
Figure 15: Educational attainment of educational commission and board appointees, by race and ethnicity, March 15, 2022
Source: UCLA LPPI analysis of the demographic composition and educational attainment of 83 educational board and commission appointees, as of March 15, 2022.
Note: Educational degrees include associate, bachelor’s, master’s, doctors of medicine, juris doctors, doctors of philosophy, and master’s of business administration. Totals do not add up to 83 appointees due to double counting. One appointee identified as both Chicana and a member of the Cherokee Nation and was double counted as Latino and American Indian/Alaskan Native. Additionally, UCLA LPPI could not confirm the race and ethnicity of 15 (18.1%) of the 83 appointments analyzed.
5. Executive boards and commissions responsible for overseeing California’s workforce development initiatives underrepresent Latinos and overrepresent the state’s coastal residents.
Workforce development and economic opportunity boards and commissions consist of six executive boards and commissions (140 of the 420 board and commission appointments). As of March 2022, 130 of these appointments were filled, leaving 10 vacancies. (See Table A6 in the appendix for an overview of all the workforce development and economic opportunity boards and commissions tracked by UCLA LPPI.)
As the workforce development boards and commissions advise the state administration on strategies for strengthening our economy, Latinos will need targeted support and should play a critical role at the agenda-setting table. Latinos contribute over $706.6 billion to California’s GDP and are key drivers of income and job creation growth for the state.29 However, while certain sectors and classes of workers thrived during the pandemic, COVID-19 created volatile conditions that markedly affected Latino communities and families. Today, Latinos face disproportionately high rates of unemployment,30 poverty,31 business insolvency,32 housing instability,33 and food insecurity.34 Despite these disadvantages, the future of California’s workforce is Latino. Latinos and Latinas have some of the highest workforce participation rates among all other racial groups. Whereas non-Hispanic white men have labor force participation rates of 68% and non-Hispanic white women are at 56%, Latinos continue to participate at a rate of 77%, and Latinas at 59%.35
Latinos would need to make up 39.1% of workforce development-related appointees to meet proportional representation, which means that about 51 of the 130 active appointments should be Latino. However, as shown in Figure 16, only 20% of these executive commission appointees are Latino (26 of 130). The respective appointing powers, including the governor, state legislators, and other state/local entities, need to add at least 25 Latinos to achieve proportional representation.
Figure 16: Workforce development and economic opportunity commission appointees, by race/ethnicity and gender, March 15, 2022
Source: UCLA LPPI analysis of the demographic composition of 130 economic development boards and commission appointees, as of March 15, 2022.
Note: Appointment shares do not add up to 100% due to double counting and rounding. One individual identified as Afro-Latino and is double counted as both Black and Latino. Due to rounding, men and women percentages do not add up to total race/ethnic shares. Additionally, UCLA LPPI could not confirm the race and ethnicity of 18 (13.8%) of the 130 appointments analyzed.
![]()
Given their purview over economic growth and development in the state, workforce development and economic opportunity boards and commissions should reflect the considerable economic differences among regions of California. Differing industries, job opportunities, and workforce needs have resulted in uneven economic growth. Whereas the urban coast is more aptly characterized by its expanding job market and unmet workforce demands, Central California has a fast-growing workforce, projected to grow by more than 25% by 2030, and high unemployment rates.36 However, as depicted in Figure 17, which shows where educational board and commission appointees reside compared to the size of the regional population they represent, Central California, and Southern California (Greater Los Angeles, Inland Empire, and the Southern Border) remain underrepresented. For example, only 24.6% of these commission and board appointees (32 of 130 appointees) are from Greater Los Angeles, which is home to over 35.7% of the state’s total population and 40.9% of its Latinos. Similarly, despite its central economic role in agriculture, Central California makes up only 8.5% of these board and commission appointees (11 of 130 appointees) despite being home to 15% of the state’s population.
Figure 17: Geographic representation of workforce development and economic opportunity board and commission appointees, compared to the geographic composition of all California residents and Latino residents, March 15, 2022
Source: UCLA LPPI analysis of the demographic composition and geographic residence of 130 economic development board and commission appointees, as of March 15, 2022; 2016-20 5-year American Community Survey public use microdata.
Note: One appointee was excluded since they resided outside California. See Table A8 in the appendix for geographic definitions for the California regions mentioned in the chart above.
6. Executive boards and commissions responsible for overseeing California’s criminal justice system have the lowest representation of Latinos.
California has four criminal justice executive boards and commissions, with 31 of the 420 active board and commission appointments. As of March 2022, 29 of these appointments were filled, leaving two vacancies. (See Table A7 in the appendix for an overview of all the criminal justice boards and commissions tracked by UCLA LPPI.)
Although Latinos make up over 40% of the jail and prison population in California37 and Latino youth are 65% more likely than white youth to encounter the justice system,38 little attention has been paid to how the criminal justice system specifically impacts Latinos. Targeted reforms are necessary to achieve public safety for all and address the far-reaching economic, political, and social consequences of incarcerating the state’s growing and increasingly young Latino communities.
Latinos would need to make up 39.1% of these appointees to meet proportional representation, meaning roughly 11 of the 29 active criminal justice commission appointments should be Latino. However, as shown in Figure 18, only 10.3% of these executive commission appointees are Latino (3 of 29). The respective appointing powers, including the governor, state legislators, and other state/local entities, must add at least eight Latinos to achieve proportional representation.
Figure 18: Criminal justice commission appointees, by race/ethnicity and gender, March 15, 2022
Source: UCLA LPPI analysis of the demographic composition of 29 criminal justice commission appointees, as of March 15, 2022.
Note: Appointment shares do not add up to 100% due to double counting and rounding. One individual identified as Afro-Latina and is double counted as both Black and Latina for this analysis. Additionally, UCLA LPPI could not confirm the race and ethnicity of seven (24.1%) of the 29 appointments analyzed.
![]()
The impact of the state’s incarceration system is not only racially disparate but also geographically distinctive. Although the most populated and urban counties in California have the largest number of incarcerated residents, the highest rate of prison and jail admissions per capita are in the state’s rural regions.39Therefore, any policy or regulation of the carceral system must include geographically diverse representation. Figure 19 shows how criminal justice appointments lack representation from Central and Southern California. The Greater Sacramento region makes up 31% of board and commission appointees (9 of 29 appointees), 24.8 percentage points over its share of the state’s population. In comparison, Northern California, despite its smaller population, encompasses four of the top five counties with the highest rates of adult prison admissions,40 yet has zero representation on these governing entities. Similarly, Southern California (Great Los Angeles, the Inland Empire, and the Southern Border) has some of the largest counts of incarcerated residents.41 Still, only 24.1% of criminal justice board and commission members represent the region (7 out of 29 appointees).
Figure 19: Geographic representation of criminal justice board and commission appointees, compared to the geographic composition of all California residents and Latino residents, March 15, 2022
Source: UCLA LPPI analysis of the demographic composition of 29 criminal justice commission appointees, as of March 15, 2022; 2016-20 5 year American Community Survey public use microdata.
Note: See Table A8 in the appendix for geographic definitions for the California regions mentioned in the chart above.
Conclusions & Policy Recommendations
Our analysis demonstrates that Latinos are severely underrepresented in California’s executive branch appointments, including cabinet leadership and executive boards and commissions. At just 18.4%, the share of Latino appointments is far below the state’s 39.1% Latino population share, a representation gap of 20.5 percentage points. However, our analysis of the demographic composition of executive branch appointments emphasizes the underrepresentation of not only Latinos but also the lack of equitable representation of the vast racial, ethnic, geographic, age, and gender diversity that makes up California. Non-Hispanic whites remain the largest and best-represented group across all appointment categories. They make up over 48% of executive appointments despite making up 36.5% of the state’s total population. This historical imbalance is perpetuated by the internal mechanics of appointments, such as unspecified term limits and the practice of granting regular reappointments. As of March 2022, non-Hispanic whites made up 63.1% of reappointments and 52.4% of appointees with undefined term limits.
The lack of diversity in executive appointments significantly affects representation across key decision-making tables in California’s government. Executive appointments play a significant role in advising the governor and influencing policymaking for state departments and agencies. The topics covered by these appointments range from professional licensing and environmental protection to public safety and K-12 educational standards. Their responsibilities encompass broad powers such as drafting regulations, reviewing appeals, supervising policy implementation, and allocating public resources. Latinos remain underrepresented across all major board and commission issue areas, making up only 14.6% of appointments that regulate the environment, 27.7% of appointments that set educational policy, 20% of appointments that manage workforce and economic development issues, and 10.3% of appointments that oversee criminal justice systems.
Based on our findings, we recommend the following:
- Pass California Senate Bill 1387, which would direct the governor’s Office to build internal capacity to track and report the demographic makeup of gubernatorial appointments.
- Issue an executive order that sets governmentwide directives for reaching proportional representation, ensuring that appointments better reflect the state’s diverse constituencies across race and ethnicity, age, gender, sexual orientation, geographic residence, and more. These representational standards should be set at an individual entity level (e.g., for a commission, board, or department) to ensure that all voices are heard at every decision-making table.
- The governor’s office should direct the state’s appointment team to review the bylaws and statutes of executive boards and commissions to ensure that all appointments have appropriate terms and defined term limits. Doing so would create a regular stream of openings on key boards and commissions where diverse candidates could be recruited and appointed.
- The governor’s office should limit the practice of granting legacy reappointments to boards and commissions. Instead, the administration can leverage term limits and position openings as opportunities to appoint new candidates who can not only introduce additional perspectives but also better represent California’s increasingly diverse constituencies.
Endnotes
1 Eligibility and qualification requirements for appointments vary but
are outlined in the bylaws and statutes of an entity. The Office of Gavin Newsom consolidates the statutes of all executive commissions on its appointments home page, available online.
2 Shah, Sonal, and Hollie Russon Gilman, Rebuilding Trust in American Institutions (Stanford: Stanford Social Innovation Review, 2021), available online.
3 Office for Democratic Institutions and Human Rights, Effective Participation and Representation in Democratic Societies (Europe: Organization for Security and Co-operation in Europe, 2007), available online.
4 U.S. Census Bureau, Racial and Ethnic Diversity in the United States: 2010 Census and 2020 Census, (United States Census Bureau, 2021) available online.
5 Rory Carroll, Latinos Officially the biggest ethnic group in California (Los Angeles: The Guardian, July 8, 2015), available online.
6 Other governor includes appointments made by governors Edmund (Jerry) Brown Jr. (1975–83 and 2011–19), Arnold Schwarzenegger (2003–11), Gray Davis (1999–2003), Pete Wilson (1991–99), and George Deukmejian (1983–91).
7 Analysis of appointers of executive appointments conducted by UCLA LPPI.
8 Office of Gavin Newsom, California State Government – Executive Branch, (Sacramento: Office of Governor Gavin Newsom, accessed on April 4, 2022), available online.
9 There are hundreds of statewide boards and commissions across government departments. LPPI tracks 45 of the 50 commissions and boards that make up the state of California’s “executive branch.” The following five boards and commissions were excluded from this tracking effort because these commissioners were not directly appointed by California governors or state legislators: Board of State and Community Corrections, California Tahoe Conservancy, Franchise Tax Board, Native American Heritage Commission, and the State Lands Commission.
10 For this analysis, ex-officio members, who are seated on boards and commissions because of their given position (e.g, elected office or state department representative) and thus not directly appointed to the executive branch, were excluded.
11 Office of Gavin Newsom, Appointments, (Sacramento: Office of Governor Gavin Newsom, accessed April 5, 2022), available online.
12 State and local appointing entities include but are not limited to: county Board of Supervisors, city council, municipal mayors, water authority and irrigation district board members, CaiPERS system, state controller, secretary of state, and the attorney general.
13 Office of Governor Gavin Newsom, Newsroom, (Sacramento: Office of Governor Gavin Newsom, accessed March 23, 2022), available online.
14 Office of Governor Gavin Newsom, List of Appointments – Governor’s Appointment index, (Sacramento: Office of Governor Gavin Newsom, accessed March 23, 2022),available online.
15 U.S. Census Bureau, About the Topic of Race, (US: United States Census Bureau, accessed April 1, 2022),available online.
16 UCLA LPPI analysis of American Community Survey (ACS) 2016-20, five-year estimates.
17 A total of 17 appointees were removed from this analysis because no definite appointment date could be found for their current term. All 17 were appointed by legislators, or other state and local governments, and did not have public announcements about their appointment. Among these 17 appointments: Nine were non-Hispanic white, five Latino, one Black, and two were identified as unknown.
18 Statutes and bylaws define the number of reappointments allowed on a given board and commission. However, 41 of the 45 commissions tracked by UCLA LPPI have no stated term limits in their statutes. In other words, these commissioners can be indefinitely reappointed by their respective appointing authorities upon completion of their prior term.
19 Adrianna Quintero and Juanita Constible. “Nuestro Futuro: Climate Change and U.S. Latinos” (Natural Resources Defense Council, 2016), available online.
20 Education Data Partnership, State Summary: California Public Schools, (California: Education Data Partnership, accessed March 31, 2022),available online.
21 The University of California’s Hispanic-Serving Institutions (HSI) Initiative, La Lucha Sigue: The University of California’s Role as a Hispanic-Serving Research Institution System, (California: The University of California’s HSI Initiative, 2021), available online.
22 Taemin Ahn, Hector De Leon, Misael Galdámez, Ana Oaxaca, Rocio Perez, Denise Ramos-Vega, Lupe Reneteria Salome, and Jie Zong, 15 Facts about Latino Well-Being in California (Los Angeles: UCLA Latino Policy and Politics Institute, 2022), available online.
23 Ibid.
24 According to LPPI-UCLA analysis of executive commissions, eight of the 83 active educational appointments are student members. Latinos make up five of these eight appointments.
25 Center for Social Innovation UCR, State of Education Equity in the Inland Empire, (Irvine: Center for Social Innovation UCR, 2020), available online.
26 Public Policy Institute of California, Wide Gaps In Achievement For Central Valley Students: Sacramento A Standout, San Joaquin Falls Behind, (San Francisco: Public Policy Institute of California, 2002), available online.
27 UCLA LPPI analysis of the demographic composition of 83 Educational Commission Appointments, as of March 2022.
28 Hazel Kelly, CSU Highlighted for Role in Educating Latina/o Students in Excelencia Report, (Long Beach: The California State University, 2021), available online.
29 Dan Hamilton, Matthew Fienup, David Hayes-Bautista, and Paul Hsu, 2021 State Latino GDP Report: California, (Los Angeles: California Lutheran University and UCLA Health, Center for the Study of Latino Health and Culture, 2021),available online.
30 Luis Noe-Bustamante, Jens Manuel Krogstad and Mark Hugo Lopez, For U.S. Latinos, COVID-19 Has Taken a Personal and Financial Toll, (Washington DC: Pew Research Center, 2021)available online.
31 Taemin Ahn, Hector De Leon, Misael Galdámez, Ana Oaxaca, Rocio Perez, Denise Ramos-Vega, Lupe Reneteria Salome, and Jie Zong, 15 Facts about Latino Well-Being in California.
32 Sivlia R. Gonzalez, Rodrigo Dominguez-Villegas, and Kassandra Hernandez, Disparities in the Distribution of Paycheck Protection Program Funds in California’s Congressional Districts, (Los Angeles: UCLA Latino Policy and Politics Institute, 2021), available online.
33 Noerena Limón, Jaimie Smeraski, Julie Aguilar, Dustin Robinson, Angel Aguilar, Josue Andrade Rivera, 2021 State of Hispanic Homeownership (San Diego: NAHREP, 2022) available online.
34 Latino Coalition for a Healthy California, Securing Food, Securing Our Future: The Impact of Food Insecurity on Latinx Children & Families, (Sacramento: Latino Coalition for a Healthy California, Nourish California and The Children Partnership, 2021), available online.
35 Taemin Ahn, Hector De Leon, Misael Galdámez, Ana Oaxaca, Rocio Perez, Denise Ramos-Vega, Lupe Reneteria Salome, and Jie Zong, 15 Facts about Latino Well-Being in California.
36 Scott Anderson, California Economic Outlook – August 2021 (San Francisco: Bank of the West, 2021), available online.
37 Scott Graves, Racial disparities in California’s state prisons remain large despite justice system reforms (Sacramento: California Budget and Policy Center, 2021), available online.
38 Sonja Diaz, Adriana Bernal, Julie Aguilar, and Maria Morales, The Latinx Data Gap in the Youth Justice System, (Los Angeles: UCLA Latino Policy and Politics Institute, 2020), available online.
39 Vera Institute for Justice, Incarceration Trends in California, (New York: Vera Institute for Justice, 2019),available online.
40 As of December 31, 2016, Shasta, Tehama, Yuba, and Siskiyou counties had the highest rates of adult prison admissions in all of California. A detailed list of prison populations by county in California can be found at the California Sentencing Institute data project, (San Francisco: Center on Juvenile and Criminal Justice, 2022), available online.
41 As of 2015, Los Angeles (156,433 incarcerated), San Diego (86,116 incarcerated), San Bernardino (74,199 incarcerated), and Orange (59,381 incarcerated) had the largest number of residents incarcerated in the state annually. More county data counts may be found at Incarceration Trends in California, (New York: Vera Institute for Justice, 2019),available online.