The Labor Market Experiences of Working-Age Afro-Latinxs
Acknowledgements
The authors would like to thank: Jennifer Uribe and Jie Zong for their thoughtful reviews and suggestions; Cris Rivera and Alberto Lammers for their support with communications; Shanthony Exum for the visuals and design; Jorge Renaud for his policy expertise; and Michelle Holder for her thorough review of this report.
This report was made possible by the generous support of the James Irvine Foundation. Core operating support for the UCLA Latino Policy and Politics Institute is provided by the California Latino Legislative Caucus.
The UCLA Latino Policy and Politics Institute acknowledges the Gabrielino/Tongva peoples as the traditional land caretakers of Tovaangar (the Los Angeles basin and So. Channel Islands). As a land grant institution, we pay our respects to the Honuukvetam (Ancestors), ‘Ahiihirom (Elders), and ‘Eyoohiinkem (our relatives/relations) past, present, and emerging.

Executive Summary
Challenging labor market conditions—including unemployment, poor job quality, and instability—have long affected workers of color in the U.S., especially compared to white workers. For example, Black workers’ unemployment rate has been twice that of white workers since the 1970s,1 while Latino unemployment has remained roughly 1.5 times higher than that of white workers since 2000.2
Yet Latinos are not a monolith, and we can better understand their socioeconomic experiences when we consider how gender, immigration status, national origin, ethnicity, and race—among other social positions—intersect and shape those experiences.3 Much of the research on Latino labor force outcomes assumes that all Latinos experience race the same way. However, Afro-Latinxs—or individuals who identify as Black Latinos4—may be subjected to the labor market’s anti-Black bias in a way that does not affect non-Black Latinos.5
In this report, we use the Current Population Survey (CPS) microdata to analyze labor market outcomes for the prime-age (25-54 years old) Afro-Latinx workers from 2010 to 2022. We seek to understand their unique experiences with unemployment and labor force participation. As we demonstrate, Afro-Latinxs are a fast-growing, young group with a larger share possessing a bachelor’s degree or higher than their non-Black Latino peers.6
Based on our analysis of the Current Population Survey, we find that:
- From 2010 to 2022, unemployment and labor force outcomes for Afro-Latina women were closer to those of Black women than non-Black Latina women.
- During the pandemic’s economic downturn, Black, Afro-Latina, and non-Black Latina women experienced similar unemployment and labor force shocks.
- Afro-Latino men experienced worse unemployment and labor force outcomes than non-Black Latino men but better outcomes than those of Black men between 2010 and 2022.
- During the pandemic’s economic downturn, Black and Afro-Latino men experienced harsher unemployment and labor force shocks than their non-Black peers.
- Among the U.S.-born, unemployment rates for Afro-Latina women and Afro-Latino men were closer to their Black peers than their non-Black Latina/o peers from 2010 to 2022.
We provide preliminary evidence that Afro-Latinx workers ages 25 to 54 are subject to the anti-Black bias in the labor market. Over the last decade and a half, prime-age Afro-Latinx workers have experienced worse labor force outcomes than their non-Black Latino peers. Additionally, for both male and female Black Latinos, workforce trends closely track those of Black workers (see Table 1).
Table 1. Unemployment Ratios for Afro-Latinx, non-Black Latino, and Black Workers by Gender, Ages 25 to 54
1= Equal Unemployment to Non-Hispanic white Peers
Source: UCLA LPPI analysis of 2010-2022 Current Population Survey basic monthly sample public use microdata.
Notes: Data are for the prime-age, civilian, non-institutionalized population and are not seasonally adjusted. The prime-age population refers to people aged 25 to 54, who are most likely to work, regardless of nativity and includes Puerto Ricans living on the mainland, regardless of birthplace.
We suggest the following policy recommendations that focus on combating structural barriers in the labor market:
- Collect demographic data that captures the complexity of race and lived experiences in local, state, and federal institutional data.
- Increase funding and capacity for anti-discrimination enforcement agencies at federal, state, and local levels, especially the Equal Employment Opportunity Commission.
- Reduce the incarceration rate and facilitate re-entry into employment.

Introduction
Challenging labor market conditions—including unemployment, job quality, and instability—have long affected workers of color in the U.S., especially compared to white workers. For example, Black workers’ unemployment rate has been twice that of white workers since the 1970s,7 while Latino unemployment has remained roughly 1.5 times that of white workers since 2000.8
Economic downturns magnify unemployment inequities. During recessions, Black and Latino workers are more likely to experience unemployment than white workers.9 Black and immigrant workers are also among the first fired when the economy weakens.10 For example, at peak COVID-19 unemployment levels in April 2020, Latino and Black workers were the most likely to lose their jobs.11 Further, during the first year of the pandemic, Latinos were the most at risk of becoming unemployed or experiencing a pay cut.12 A much smaller share of Black and Latino workers could work remotely compared to white workers during the pandemic.13
Experiences of persistent unemployment and job loss can also lead workers to become discouraged and leave the workforce altogether. Latinas, Black men, and Black women workers are especially likely to leave the workforce altogether after experiencing unemployment.14 Indeed, previous UCLA Latino Policy and Politics Institute (LPPI) research found that in the first year of the pandemic, Latinas were the most likely group to exit the workforce.15
For Black workers, significant racial inequities in Black-white unemployment exist at every education level, across age groups, and among both men and women.16 For Black men in particular, high unemployment levels also result in some leaving the workforce altogether and, consequently, low labor force participation levels. Moreover, these persistent workforce inequities have remained unchanged for 40 years.17
Economic research also suggests that employers are reluctant to hire Black workers, viewing them as less productive than other workers due to assumptions about poor educational training, a weak work ethic, and association with crime and incarceration.18 Together, these patterns highlight how the forces of anti-Blackness and other forms of racial discrimination in the workforce result in structural Black-white labor force gaps and consistent levels of discrimination against Black workers over the last few decades.19
Much of the existing research assumes that Latinos experience race, racialization, and discrimination the same way.20 Yet Latinos are not a monolith, and their experiences vary with their gender, immigration status, national origin, and race, among other factors.21 Afro-Latinxs—or individuals who identify as Black Latinos—may be subjected to anti-Black bias in the labor market in ways that are substantively different from the experience of non-Black Latinos.

Data and Methodology
Building on the research of Michelle Holder, Alan A. Aja, and others, this report examines the unemployment and labor force outcomes of Afro-Latinxs compared to those of non-Black Latinos.22 We use an intersectional approach to understand how race, ethnicity, gender, educational attainment and other distinct factors come together to form unique lived experiences.23 This allows us to expose inequalities within workforce trends that may otherwise remain invisible.
Using the Current Population Survey, we present descriptive data from 2010 to 2022, capturing the economic recovery following the Great Recession (2007-2009) and the COVID-19 pandemic economic recession (2020). The CPS is administered jointly by the U.S. Census Bureau and the Bureau of Labor Statistics and is a representative monthly survey of 60,000 households. It is the primary source of labor force, employment, and earnings data for the U.S.24
We use CPS race and ethnicity data to construct four mutually exclusive racial and ethnic groups: Afro-Latinxs, non-Black Latinos, non-Hispanic Black, and non-Hispanic white.25 We define Afro-Latinxs as those workers who self-identify as Black Latinos—“Hispanic or Latino” in the Hispanic ethnicity question and “Black” in the race question, regardless of the combination.26 Similarly, we define the Black population as individuals who self-identify as Black or African-American, but not Hispanic or Latino, regardless of the combination.27 We also analyze each of our four racial and ethnic groups by gender.28
Because Afro-Latinxs are much younger than other groups,29 we focus our research on workers ages 25 to 54 to ensure a direct comparison between groups. This population is also known as the “prime-age” workforce, meaning they are old enough to have completed school but too young to retire. People ages 25 to 54 are also the most likely to be employed.30 Additionally, we analyze data from 2010 to 2022 to capture labor force participation and unemployment rates after the end of the Great Recession through recovery from the COVID-19 pandemic. Lastly, we present annual data, as it provides the largest possible sample size while providing trends across time.31
This report begins with a brief socioeconomic analysis to contextualize our race, ethnicity, and gender groups. The report then analyzes labor force patterns by gender, race, and ethnicity. We conclude with policy recommendations to reduce workforce inequities.

Findings
Socioeconomic Characteristics of Afro-Latinx Workers Ages 25 to 54
Afro-Latino men and Afro-Latina women are fast-growing, young demographic groups. From 2010 to 2022, the number of prime working-age Afro-Latinos grew from 357,000 in 2010 to 796,000, an increase of 123% (see Table 2). Similarly, Afro-Latinas grew from 431,000 to 836,000 over the same period, an increase of 94%. While Afro-Latinx growth has outpaced all other demographic groups presented here, they represented only 1.3% of all prime-age men and women in 2022.
When compared with their non-Black Latino peers, Afro-Latinxs are more likely to reside in the Northeast, more likely to be born in the U.S., less likely to be married, and younger. However, all Latinos—including Black and non-Black Latinas and Latinos—are more likely to be ages 25 to 54 relative to white workers (Appendix 1 and 2).
Regardless of gender, Afro-Latinxs are less likely to be immigrants when compared to non-Black Latinos. About 46% of Afro-Latino men were born outside the U.S., compared to about 55% of non-Black Latino men. Similarly, just 42% of Afro-Latinas were immigrants compared to 52% of non-Black Latinos (Appendix 1 and 2).
Afro-Latinxs are more likely to have completed a bachelor’s degree than non-Black Latinos but less likely than their respective non-Latino Black and white counterparts. As of 2022, 23% of Afro-Latino men ages 25 to 54 have completed a bachelor’s degree or more—up from 10% in 2010 and more than the share of non-Black Latinos (20%). Similarly, Afro-Latina women’s college attainment increased from 17% in 2010 to 29% in 2022, a higher rate than for non-Black Latinas (26% in 2022).
Table 2. Prime-Age (25 to 54) Population Growth and Educational Attainment Rates by Race, Ethnicity, and Gender, 2010 to 2022
Source: UCLA LPPI analysis of 2010-2022 Current Population Survey basic monthly sample public use microdata.
Notes: Data are for the prime-age, civilian, non-institutionalized population and are not seasonally adjusted. The prime-age population refers to people aged 25 to 54, who are most likely to work.
Women
Key Finding 1. From 2010 to 2022, Afro-Latina labor force outcomes were closer to those of Black women than to those of non-Black Latinas.
Unemployment and labor force participation levels for Afro-Latinas generally follow those of Black women. For example, while unemployment rates decreased for all groups from 2010 to 2019, Black and Afro-Latina women experienced the highest unemployment rates among women (see Figure 1). At low unemployment levels in 2019, Black women (4.8%) and Afro-Latinas (4.7%) were the most likely to be out of work.
Non-Black Latinas were more susceptible to unemployment than white women but less than their Black and Afro-Latina counterparts. In 2019, non-Black Latina unemployment was 4%, higher than the rate for white women (2.6%) but lower than for their Afro-Latina and Black peers.
On average, Afro-Latinas and Black women were both twice as likely to be unemployed as white women from 2010 to 2022, highlighting the similarities in labor force experiences between the two groups. Non-Black Latinas were 1.7 times more likely to be unemployed than white women, on average.
Figure 1. Unemployment Rates for Women Ages 25 to 54 by Race and Ethnicity, 2010 to 2022
Source: UCLA LPPI analysis of 2010-2022 Current Population Survey basic monthly sample public use microdata.
Notes: Data are for the prime-age, civilian, non-institutionalized population and are not seasonally adjusted. The prime-age population refers to people aged 25 to 54, who are most likely to work.

Regarding labor force participation, Afro-Latinas were more likely to participate in the labor force than non-Black Latinas from 2010 to 2022 (Figure 2). As of 2022, about 76% of Afro-Latinas were working or looking for work, compared to 69% of non-Black Latinas. In contrast, non-Black Latinas had the lowest participation rates across the time period of all groups of women analyzed here.
Among women workers aged 25 to 54, Black women generally maintained the highest labor force participation rates from 2010 to 2022. In 2022, 79% of Black women were working or looking for work, the highest share of all groups analyzed here.
Figure 2. Labor Force Participation Rates for Women Ages 25 to 54 by Race and Ethnicity, 2010 to 2022
Source: UCLA LPPI analysis of 2010-2022 Current Population Survey basic monthly sample public use microdata.
Notes: Data are for the prime-age, civilian, non-institutionalized population and are not seasonally adjusted. The prime-age population refers to people aged 25 to 54, who are most likely to work.
Key Finding 2. The pandemic’s economic downturn affected Black, Afro-Latina, and non-Black Latina women similarly.
Afro-Latinas, non-Black Latinas, and Black women all experienced the pandemic’s unemployment shock similarly. In 2020, Afro-Latinas, non-Black Latinas, and Black women were about 1.7 times as likely to be unemployed as white women, with unemployment rates for all three groups hovering around 10% (see Table 3).
The pandemic also significantly affected Black women and Latinas’ labor force participation.32 From 2019 to 2020, Black women and non-Black Latinas experienced the greatest one-year decreases in labor force participation rates of the groups of women we examined (about 2 percentage points each). For Black women and non-Black Latinas, this was accompanied by 2.6% and 2% reduction in the number of workers, respectively. Labor force participation for prime-age Afro-Latinas—who experienced the highest unemployment levels among women in 2020—also decreased 0.7 percentage points from 2019 to 2020. Together, these findings suggest that downturns affect Black, non-Black Latina, and Afro-Latina workers similarly.
In the subsequent recovery, however, unemployment rates for women reverted to their pre-pandemic patterns by race and ethnicity (see Figure 1). In 2022, Afro-Latina (5.9%) and Black women (5.5%) had substantially higher joblessness rates than the other two groups. Non-Black Latinas were in the middle of the pack (3.7%), with higher than average unemployment rates but below those of their Black peers. White women (2.5%) had the lowest unemployment rates.
Table 3. Labor Force Indicators for Women Ages 25 to 54 by Race and Ethnicity, 2019 to 2020
Source: UCLA LPPI analysis of 2010-2022 Current Population Survey basic monthly sample public use microdata.
Notes: Data are for the prime-age, civilian, non-institutionalized population and are not seasonally adjusted. The prime-age population refers to people aged 25 to 54, who are most likely to work.

Men
Key Finding 3. Afro-Latino men experienced worse labor force outcomes than non-Black Latino men but better outcomes than those of Black men.
At both their lowest and highest unemployment levels, prime-age Afro-Latino men were more likely to be out of work than their non-Black Latino peers. At low unemployment levels in 2019, for instance, Afro-Latino men still had unemployment rates half a percentage point above those of their non-Black Latino peers (3.5% vs. 2.9%; see Figure 3).
Black men, however, experienced persistently elevated unemployment, even above the levels of their Afro-Latino peers. In 2019, for example, 5.5% of prime-age Black men were out of work, two percentage points higher than for Afro-Latinos.
While no group experienced unemployment parity with white men, Black and Afro-Latino workers were much more likely to be jobless in comparison. On average, Black men were 2.2 times more likely to be unemployed when compared to white men from 2010 to 2022, while Afro-Latino men were 1.6 times more likely to be unemployed than white men.
Non-Black Latino men came the closest to experiencing unemployment parity with white men. On average, non-Black Latino men were 1.3 times more likely to be unemployed than white men from 2010 to 2022.
Figure 3. Unemployment Rates for Men Ages 25 to 54 by Race and Ethnicity, 2010 to 2022
Source: UCLA LPPI analysis of 2010-2022 Current Population Survey basic monthly sample public use microdata.
Notes: Data are for the prime-age, civilian, non-institutionalized population and are not seasonally adjusted. The prime-age population refers to people aged 25 to 54, who are most likely to work.

Turning to labor force participation, Afro-Latino men consistently experienced lower labor force participation levels than their non-Black Latino peers (see Figure 4). From 2010 to 2022, Afro-Latino men were 2 to 5 percentage points less likely to be at work or looking for work than their non-Black Latino peers. As of 2022, labor force participation rates for Afro-Latino men were at 86%, 4.8 percentage points lower than for non-Black Latino men (89.2%).
Low labor force participation rates for Afro-Latino men resemble those of their Black peers, although not to the same degree. At no point did Black men’s labor force participation rates ever reach 85%—a threshold that all other groups maintained throughout the period. As of 2022, labor force participation rates for Black men were only 82.5%, 3.5 percentage points lower than for Afro-Latino men and 6.7 percentage points lower than for white men.
In contrast, non-Black Latinos were the most likely to participate in the workforce over the last two decades. At any point in time, more than 90% of non-Black Latino men were at work or looking for work. Non-Black Latinos were also more likely to participate in the workforce than Afro-Latinos, despite Afro-Latinos’ relative youth and higher levels of college completion. These two factors usually encourage labor force participation.33
Figure 4. Labor Force Participation Rates for Men Ages 25 to 54 by Race and Ethnicity, 2010 to 2022
Source: UCLA LPPI analysis of 2010-2022 Current Population Survey basic monthly sample public use microdata.
Notes: Data are for the prime-age, civilian, non-institutionalized population and are not seasonally adjusted. The prime-age population refers to people aged 25 to 54, who are most likely to work.

Key Finding 4. During the pandemic’s economic downturn, Black and Afro-Latino men experienced harsher labor force shocks than their non-Black peers.
Pandemic unemployment shocks hit Black and Afro-Latino men equally hard. In 2020, Black men were 1.9 times more likely to be unemployed than white men, while Afro-Latinos were 1.8 times more likely to be unemployed (see Table 4), and one in 10 Black and Afro-Latino men were unemployed. Non-Black Latinos were only 1.5 times more likely to be unemployed than white men in 2020.
Afro-Latino men also experienced a harsher pandemic unemployment shock than non-Black Latino men. About 8.4% of non-Black Latino men were unemployed, compared to 9.9% of Afro-Latino men. Afro-Latino men experienced higher unemployment rates than non-Black Latino men despite boasting higher levels of educational attainment—generally speaking, higher levels of education lead to lower unemployment and greater employment stability.34
Additionally, groups with high unemployment rates experienced significant changes in their labor force size and participation from 2019 to 2020. Prime-age Afro-Latino men experienced a 0.7 percentage point decrease in labor force participation rates from 2019 to 2020. However, the Afro-Latino workforce shrank more than that of any group of men. In the first year of the pandemic, more than 19,000 Afro-Latino men left the workforce, a 3.1% decrease.
By comparison, the non-Black Latino labor force shrank by 0.6 percentage points from 2019 to 2020, with 67,000 workers leaving the workforce. Despite the non-Black Latino workforce being 20 times the size of the Afro-Latino workforce, Afro-Latino men accounted for a quarter of all Latino male labor force exits in 2020.
Prime-age Black workers experienced the largest one-year decline in labor force participation rates among men from 2019 to 2020 (-3.2 percentage points). Additionally, the Black male labor force shrank by 2.1%, with approximately 138,000 workers leaving the workforce.
Table 4. Labor Force Indicators for Men Ages 25 to 54 by Race and Ethnicity, 2019 to 2020
Source: UCLA LPPI analysis of 2010-2022 Current Population Survey basic monthly sample public use microdata.
Notes: Data are for the prime-age, civilian, non-institutionalized population and are not seasonally adjusted. The prime-age population refers to people aged 25 to 54, who are most likely to work.

U.S.-Born Workers
Key Finding 5. Among the U.S.-born, unemployment rates for Afro-Latinxs were closer to their Black peers than to their non-Black Latino peers from 2010 to 2022.
Immigration status can also significantly affect labor force outcomes. For example, immigrants are among the first workers fired during economic downturns.35 Compared to U.S.-born workers, immigrants are more likely to experience job instability or work fewer than 35 hours a week due to labor market conditions.36 These factors could result in higher unemployment rates for groups with larger proportions of immigrants, such as non-Black Latino workers (see Appendix 1 and 2).37 By focusing on the U.S.-born population, we can facilitate greater clarity into any structural disadvantages experienced by Black workers in the labor market.
Looking at U.S.-born women, Afro-Latinas were slightly less likely to be out of work than Black women and more likely to be out of work than non-Black Latinas (see Figure 5). In 2019, for example, 4.6% of U.S.-born Afro-Latinas were out of a job, compared to 3.8% of non-Black Latinas and 4.9% of Black women.
Unemployment rates for Afro-Latinas, non-Black Latinas, and Black women converged during the pandemic, highlighting the shared impact of the pandemic on women of color. In 2020, 9.1% of Afro-Latinas had lost their jobs, compared to 8.5% of non-Black Latinas and 9.4% of Black women. However, as of 2022, non-Black Latina unemployment had returned to its pre-pandemic level, while Black and Afro-Latina unemployment was more than 2 percentage points higher than that of non-Black Latinas.
Overall, from 2010 to 2022, U.S.-born Afro-Latinas and Black women faced higher unemployment rates compared to white women. Afro-Latinas were 2.1 times more likely to be unemployed than white women, while Black women were 2.2 times more likely. Non-Black Latinas had the lowest likelihood at 1.6.
Figure 5. Unemployment Rates for U.S.-Born Women Ages 25 to 54 by Race and Ethnicity, 2010 to 2022
Source: UCLA LPPI analysis of 2010-2022 Current Population Survey basic monthly sample public use microdata.
Notes: Data are for the prime-age, civilian, non-institutionalized population and are not seasonally adjusted. The prime-age population refers to people aged 25 to 54, who are most likely to work. The CPS defines persons born in outlying U.S. territories (and those born to U.S. parents abroad) as foreign-born. Puerto Ricans born on the island are therefore excluded from the above analysis.

Looking at men, unemployment rates for U.S.-born Afro-Latinos were higher than for non-Black Latinos in most years analyzed here (see Figure 6). This inequality was especially clear during the COVID-19 pandemic when Afro-Latino unemployment reached 11.9%, almost a percentage point higher than for Black men (11%) and two percentage points higher than for non-Black Latinos (9.5%). As of 2022, U.S.-born Afro-Latino unemployment remained elevated alongside U.S.-born Black men, while non-Black Latino unemployment returned to pre-pandemic levels.
Overall, from 2010 to 2022, U.S.-born Afro-Latinos and Black men faced higher unemployment rates compared to white men. Afro-Latinos were 2.1 times more likely to be unemployed than white men, while Black men were 2.3 times more likely. Non-Black Latinos had the lowest likelihood at 1.6.
Figure 6. Unemployment Rates for U.S.-Born Men Ages 25 to 54 by Race and Ethnicity, 2010 to 2022
Source: UCLA LPPI analysis of 2010-2022 Current Population Survey basic monthly sample public use microdata.
Notes: Data are for the prime-age, civilian, non-institutionalized population and are not seasonally adjusted. The prime-age population refers to people aged 25 to 54, who are most likely to work. The CPS defines persons born in outlying U.S. territories (and those born to U.S. parents abroad) as foreign-born. Puerto Ricans born on the island are therefore excluded from the above analysis.

Discussion
The late economist William E. Spriggs once wrote:
“Many classically trained economists do not like racial discrimination as an explanation for [unemployment] gaps [between Black and white workers], because their models don’t account for it and they can’t imagine policy fixes for it. This approach ignores historical evidence that discrimination in the labor market can be obstructed.”38
Indeed, the economic literature indicates that the forces of discrimination and anti-Blackness are at work in the labor market. Discrimination and anti-Blackness result in Black workers being fired first during economic downturns39 and in persistent and unexplainable unemployment inequities that have remained constant for 40 years.40 Studies show employers are also reluctant to hire Black workers, viewing them as less productive than other workers due to assumptions about poor educational training, a lack of a strong work ethic, and assumed association with crime and incarceration.41
Building on Michelle Holder and Alan A. Aja’s research,42 we provide preliminary evidence that Afro-Latinx workers ages 25 to 54 are also subject to the anti-Black bias in the labor market. Over the last decade and a half, prime-age Afro-Latina/o workers have experienced worse labor force outcomes than their non-Black Latina/o peers.
For Afro-Latinas, the simultaneity of gender, race, and ethnicity contributes to uniquely complex labor market outcomes.43 Despite Afro-Latinas’ higher levels of educational attainment and labor force participation, they have experienced higher unemployment levels than non-Black Latinas over the last 12 years.
We also find that the unemployment experiences of Black, Afro-Latina, and non-Black Latina women were closely tied together during the pandemic’s economic downturn. In 2020, one in 10 Afro-Latinas, non-Black Latinas, and Black women were unemployed, almost twice the rate for white women. The similarities between Afro-Latina and Black women’s labor experiences extend beyond recession years. On average, both Afro-Latina and Black women were twice as likely to be unemployed as white women from 2010 to 2022.
When it comes to men, prime-age Afro-Latinos were less likely to participate in the labor market than non-Black Latinos and were more likely to be jobless. Even at low overall unemployment levels, Afro-Latino unemployment rates were still higher than those of non-Black Latino males. Prime-age Afro-Latinos also experienced a harsher unemployment shock in 2020 than non-Black Latino men despite possessing higher levels of educational attainment.
Comparisons to white men also reveal significant differences in the unemployment experiences of Black, Afro-Latino, and non-Black Latino workers. On average, Black men were more than twice as likely to be unemployed as white men—the highest probability among the three groups—while Afro-Latino and non-Black Latino unemployment rates were 1.6 times and 1.3 times higher than for white men, respectively.
For Afro-Latinos, low labor force participation levels accompanied high unemployment. Despite their relative youthfulness and higher levels of college completion, Afro-Latino men were less likely to be at work or looking for work compared to non-Black Latino workers. Additionally, in 2020, Afro-Latino men accounted for a quarter of all Latino labor force exits despite representing only 5.4% of the Latino workforce.
These findings suggest that the labor market experiences of Afro-Latinxs are distinct from those of non-Black Latinos. Between 2010 and 2022, Afro-Latinxs experienced heightened unemployment and were more susceptible to labor force shocks than their non-Black Latina/o peers, despite their higher levels of educational attainment. For both Black Latinos and Latinas, their workforce trends closely tracked those of Black workers.
And while outside the scope of this initial analysis, industry data also reveal that similar shares of Afro-Latinxs and non-Black Latinos/as are employed in vulnerable and low-wage industries (see Appendices 3 and 4), suggesting that anti-Blackness may be at play in disparate Afro-Latinx workforce outcomes.
Although our findings are descriptive,44 they demonstrate that Latinos are not a monolith, and their workforce experiences vary with their race. Future studies focused on Afro-Latinx labor force outcomes should consider how race, gender, nativity, ethnicity, educational attainment, location, and generational status factor into these experiences, as research suggests that where one was born and local markets shape experiences with gendered racism in employment.45

Policy Recommendations
We advocate for advancing policies that focus on combating the structural barriers that exist in the labor market. Workforce strategies to address inequities that do not consider systemic intersectional inequalities will fail to close unemployment and labor force gaps.46
Based on our findings, we recommend the following policy actions:
1. Collect demographic data at local, state, and federal data levels that captures the complexity of race and lived experiences.
Without accurate data, inequities in lived experience, such as those highlighted in this report, cannot be known or addressed. Because the U.S. Office of Management and Budget’s (OMB) new guidelines for federal data collection combined the two race and ethnicity questions into one demographic question47—a move which will affect all federal survey instruments, including the Census48—we risk collecting imprecise and unreliable data. Such data may fail to detect within-group inequalities in lived experience and contribute to undercounts of populations such as Afro-Latinxs.49
Detailed data collection is especially critical due to increasing demographic complexity and diversity in the U.S. A growing number of Latinos identify as Afro-Latinx and are recognizing that their experiences are distinct from those of other Latinos.50 By conflating race and ethnicity, we make it difficult for Black and Indigenous Latinos—among other groups—to designate their race (a visual status) and ethnic identity (a cultural heritage). The U.S. government also collects this data to allocate resources and elected representatives,51 therefore unreliable data collection will also result in an inequitable distribution of funding and power.
In light of the recent OMB directive that combined the race and ethnicity questions, one possibility is to add a question to Census survey instruments on “street race,” or the race one would be assumed to be based on physical appearance.52 It is important to underscore that the OMB guidelines permit additional questions. The inclusion of “street race”—or one’s race based on their visual status—would not do away with racial self-identification, but acknowledge that the way someone is perceived racially affects their lived experience. Additionally, it would allow researchers to better understand how race is encountered and experienced in the daily lives of the U.S. Latino population.53
Although the OMB’s new data directive combines race and ethnicity in one question, other organizations that are not federal agencies can still collect detailed demographic data. They should engage in data collection, analysis, and dissemination that includes additional, separate questions on race (as a visual status) and ethnicity (as a social status related to cultural heritage), as well as other parts of one’s identity that impact lived experiences (such as tribal status).54
As demonstrated in this report, Afro-Latinxs experience inequities in the labor force, especially when compared to non-Black Latinos. Such inequities are impossible to illuminate and address without clear and precise data collection, and the conflation of race and ethnicity limits the ability to inquire about race-based inequities like those of Afro-Latinxs in the labor force. Disaggregated data and a commitment to an intersectional lens in analysis and practice can lead to more accurate diagnoses of complex inequities and the targeted policymaking needed to eliminate them.
2. Increase funding and capacity for anti-discrimination enforcement agencies at federal, state, and local levels, especially the Equal Employment Opportunity Commission.
Created in 1965, the U.S. Equal Employment Opportunity Commission (EEOC) “is responsible for enforcing federal laws that make it illegal to discriminate against a job applicant or an employee because of the person’s race (both self-identified and perceived race/street race), color, national origin (ancestry), religion, sex (including pregnancy and related conditions, gender identity, and sexual orientation), national origin, age (40 or older), disability or genetic information.”55
Strict enforcement of anti-discrimination laws in the 1970s successfully closed labor market gaps.56 However, since the 1980s, the federal government has significantly decreased funding for the Commission—after accounting for inflation and other factors57—and fewer staff work for the agency today than in the early 1980s.58 There has been no decline in anti-Black discrimination in hiring since roughly the same time.59
The EEOC receives hundreds of thousands of inquiries about employment discrimination but lacks the resources necessary to ensure that each case is fully addressed.60 Increasing EEOC’s funding can help it address its backlogs and reduce the time it takes to address discrimination claims.61 This, in turn, could result in better and more fair employment outcomes for Afro-Latinxs and other populations that have experienced employment discrimination and thus faced more difficult labor force outcomes. Additionally, judicial and legal training in evaluating complex configurations of anti-Blackness—and how they uniquely impact Afro-Latinxs—could improve anti-discrimination law enforcement.62
Considering the EEOC’s capacity constraints, well-funded and staffed state anti-discrimination agencies can also ensure Afro-Latinxs have equal employment access. State-level agencies can adjudicate discrimination cases promptly and expand worker protections. However, state funding for anti-discrimination agencies is uneven (see Figure 7). For example, despite having many cases and the second-largest population in the U.S., Texas has lower funding levels than other comparably sized states.63 Governors and state legislatures should adequately fund and staff their anti-discrimination agencies to ensure they can complete caseloads in a timely manner.64
Likewise, many local governments—including Denver, Los Angeles, New York City, and Tucson, among others—have created dedicated labor agencies.65 Many local labor agencies promote workers’ rights through litigation, local ordinances, and expanded worker protections.66 The creation of local labor agencies can also complement state-level anti-discrimination policy by educating workers about their rights and providing high-quality working conditions for workers of all backgrounds.
Figure 7. Legislative Funding for State-Level Anti-Discrimination Agencies, 2022
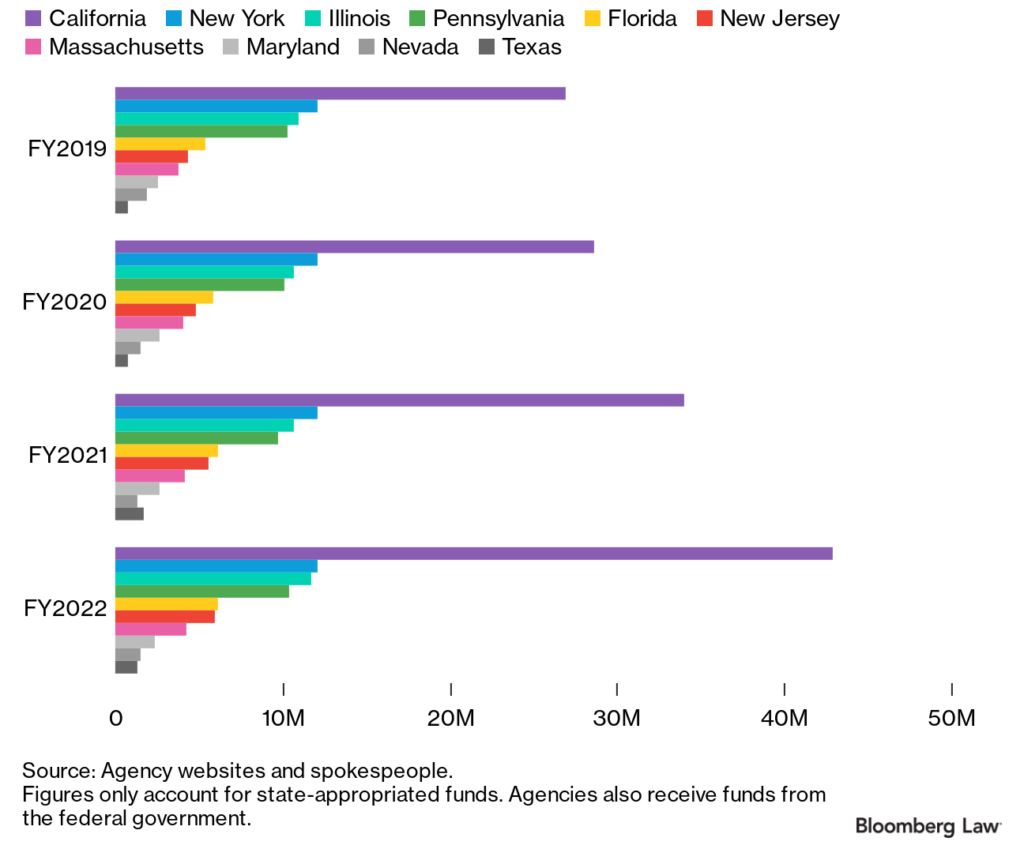
Source: Paige Smith and J. Edward Moreno, “State Anti-Bias Agency, EEOC Budgets Shift as Workloads Persist,” Bloomberg Law, available online.
3. Reduce the incarceration rate and facilitate re-entry into employment.
Reducing incarceration has the potential to lessen the workforce inequities experienced by Afro-Latinxs and other Black workers, especially men.67 Black men are incarcerated at the highest rates,68 form the largest group among incarcerated people,69 and consequently experience reduced labor force participation and employment prospects.70 Notably, Latino men are the second largest demographic group among incarcerated people.71 As a result, Afro-Latino men are doubly impacted by their Blackness and their Latinidad.
Indeed, the limited research specifically on Afro-Latinx criminal justice outcomes confirms that they experience some of the most severe outcomes relative to other groups.72 For example, research shows that arrests in Miami-Dade County are concentrated in Black Latino neighborhoods (alongside non-Hispanic Black neighborhoods).73
Reducing incarceration and facilitating re-entry into the workforce74 would likely improve Afro-Latinx employment and labor force participation outcomes.75 Potential first steps to reduce incarceration inequities include: encouraging prosecutors to prioritize serious and violent offenses,76 limiting the use of pretrial detention, and requiring training to reduce racial bias for all those involved in running our justice system.77
Additionally, one way for state and city governments to facilitate workforce re-entry of formerly incarcerated individuals is to adopt “Ban the Box” policies.78,79 Such measures prevent employers from asking job applicants about their history with the criminal justice system.80 This is because employers can and do use this information to discriminate against applicants. As the history of incarceration strongly influences Black workers’—and by extension, Afro-Latinxs’ workers—employment outcomes, governments should take the initiative to prevent incarceration-based employment discrimination. Further, enabling previously incarcerated persons to find and retain employment may be the most important step in reducing recidivism.81

Conclusion
Within the Latino community, we find that Afros-Latinxs have worse unemployment outcomes than their non-Black counterparts. While the data presented is descriptive, it suggests that Afro-Latinxs’ Blackness is racially stigmatized in very different ways compared to other non-white groups, especially non-Black Latinos. The data presented demonstrates how non-white groups experience significant barriers to accessing and thriving in the labor market.
Our research also highlights that for Latino workers, race and gender matter. As sociologists Baca Zinn and Zambrana make it plain:
“We caution that ‘Latino/Latina’ as a social construct must be problematized, that is complicated by differences in national origin, citizenship, race, class, and ethnicity and by the confluence of these factors. An intersectional approach acknowledges these differences and seeks to reveal and understand how they shape experience.”82
Researchers often aggregate the “Hispanic” or “Latino” population into a single group without regard for individuals’ gender, race, educational attainment, and nativity. However, as an analytical category, “Hispanic” or “Latino” has little to say about how this group of people is racialized and gendered—and, therefore, how they experience life—in the U.S.
Latinos are diverse, and Latinidad includes, among others, “Afro-Latinxs and Indigenous Latinxs [who] might also have different commitments than white and mestizo Latinxs, as issues of race, racism and the coloniality of power in the United States more directly affect them on a daily basis.”83 These Latino experiences of power and society are simultaneously shaped by many distinct social statuses—including race, class, gender, ethnicity, and nativity. By using an intersectional lens in analysis and practice, we can illuminate complex inequities for different groups of U.S. Latinos, and advance targeted policy solutions to deep-rooted injustices.
End Notes
1 For the purposes of this report, “Black” refers to the non-Hispanic/Latino Black population in the United States and “white” refers to the non-Hispanic white population in the U.S.; Olugbenga Ajilore, “The Persistent Black-White Unemployment Gap Is Built into the Labor Market,” Center for American Progress, September 28, 2020, available online.
2 We use the term “Latino” to refer to the population that identifies as Hispanic and/or Latina/o/x/e/@ ethnically.
Ryan Zamarripa, Closing Latino Labor Market Gap Requires Targeted Policies To End Discrimination (Washington, DC: Center for American Progress, October 21, 2020), available online.
3 Misael Galdámez, Morís Gómez, Rocio Perez, Lupe Renteria Salome, Julia Silver, Rodrigo Dominguez-Villegas, Jie Zong, and Nancy López, Centering Black Latinidad: A Profile of the U.S. Afro-Latinx Population and Complex Inequalities (Los Angeles, CA: UCLA Latino Policy and Politics Institute, April 2023), available online.
4 We use the term “AfroLatinx” to refer to the Afro-Latina/o/x/e/@ and/or Black Latina/o/x/e/@ population. We understand that individuals identify with terminology differently. We note that differences in definitions between “Black Latina” and “Afro-Latina” have become prominent among young Latinxs in particular. For instance, someone who has an African-American parent and a non-Black Latino parent may identify as a “Black Latino” but not necessarily “Afro-Latino.” On the other hand, someone who has two Black Latino parents may identify as “Afro-Latino” but not necessarily as “Black Latino.” See, for example, @jchellestryingherbest, “African American Culture Mixed with Mexican Culture is Different than Black Mexican Culture,” TikTok, February 10, 2023, available online.
5 Clara E. Rodríguez, Grigoris Argeros, and Michael H. Miyawaki, “Does Race and National Origin Influence the Hourly Wages That Latino Males Receive?” in Invisible No More: Understanding the Disenfranchisement of Latino Men and Boys, eds. Pedro Noguera, Aida Hurtado, and Edward Fergus (New York, NY: Routledge Press, 2012), 207-218, available online.
6 Michelle Holder and Alan A. Aja, “Chapter 1: Demographic and Historical Context,” in Afro-Latinos in the U.S. Economy (Lanham, Maryland: Lexington Books, 2021), 1-41.
7 Ajilore, “The Persistent Black-White Unemployment Gap Is Built Into the Labor Market.”
8 Zamarripa, Closing Latino Labor Market Gap Requires Targeted Policies to End Discrimination.
9 Tomaz Cajner, Tyler Radler, David Radner, and Ivan Vidangos, Racial Gaps in Labor Market Outcomes in the Last Four Decades and Over the Business Cycle (Washington, DC: Federal Reserve Board of Governors, June 2017), available online; and Evgeniya A. Duzhak, “How do Business Cycles Affect Worker Groups Differently?,” Federal Reserve Bank of San Francisco Economic Letter 2021-25, September 7, 2021, available online.
10 Kenneth A. Couch and Robert Fairlie, “Last Hired, First Fired? Black-White Unemployment and the Business Cycle,” Demography 47, no. 1 (February 2010): 227, available online; and Huanan Xu, “First Fired, First Hired? Business Cycles and Immigrant Labor Market Transitions,” IZA Journal of Development and Migration 8, no. 1 (October 11, 2018): 19, available online.
11 Jeanna Smialek and Jim Tankersley, “Black Workers, Already Lagging, Face Big Economic Risks,” The New York Times, June 1, 2020, available online.
12 Elise Gould, Daniel Perez, and Valerie Wilson, Latinx Workers—Particularly Women—Face Devastating Job Losses in the COVID-19 Recession (Washington, DC: Economic Policy Institute, December 3, 2020), available online; and Jens Manuel Krogstad, Ana Gonzalez-Barrera, and Luis Noe-Bustamante, “U.S. Latinos Among Hardest Hit by Pay Cuts, Job Losses due to Coronavirus,” Pew Research Center, April 3, 2020, available online.
13 Elise Gould and Jori Kandra, “Only One in Five Workers are Working from Home Due to COVID,” Economic Policy Institute, June 2021, available online.
14 Cajner et al., Racial Gaps in Labor Market Outcomes in the Last Four Decades and Over the Business Cycle.
15 Kassandra Hernández, Diana Garcia, Paula Nazario, Michael Rios, and Rodrigo Dominguez-Villegas, Latinas Exiting the Workforce: How the Pandemic Revealed Historic Disadvantages and Heightened Economic Hardship (Los Angeles, CA: UCLA Latino Policy and Politics Institute, June 14, 2021), available online
16 Valerie Wilson and William A. Darity Jr., Understanding Black-White Disparities in Labor Market Outcomes Requires Models That Account for Persistent Discrimination and Unequal Bargaining Power (Washington, DC: Economic Policy Institute, March 2022), available online.
17 Ibid; and Cajner et al., Racial Gaps in Labor Market Outcomes in the Last Four Decades and Over the Business Cycle.
18 Joleen Kirshenman and Kathryn M. Neckerman, “’We’d Love to Hire Them But…’ The Meaning of Race for Employers,” in Race and Ethnic Conflict (London: Routledge, 1994).
19 Ajilore, “The Persistent Black-White Unemployment Gap Is Built Into the Labor Market;” and Lincoln Quillian, Devah Pager, Ole Hexel, and Arnfinn Midtboen, “Meta-analysis of Field Experiments Shows No Change in Racial Discrimination in Hiring Over Time,” PNAS 114, no. 41 (2017): 10870-10875, available online.
For an economic study with similar findings, see Cajner et al, Racial Gaps in Labor Market Outcomes in the Last Four Decades and Over the Business Cycle.
20 Laura C. Chávez-Moreno, “Examining Race in LatCrit: A Systematic Review of Latinx Critical Race Theory in Education,” Review of Educational Research (September 2023), available online.
21 Galdámez et al., Centering Black Latinidad; and Tanya Katerí Hernández, Racial Innocence: Unmasking Latino Anti-Black Bias and the Struggle for Equality (Boston, MA: Beacon Press, 2023).
See also Cristian Arroyo-Santiago, “The Next Census Could Reveal a Very Different America,” CNN Opinion, May 3, 2024, available online.
22 Michelle Holder and Alan A. Aja, Afro-Latinos in the U.S. Economy (Lanham, Maryland: Lexington Books, 2021).
For an analysis of Afro-Latinxs in Massachusetts, see Trevor Mattos, Phillip Granberry, and Quito Swan, Latinos in Massachusetts: Afro-Latinos (Boston, MA: Gastón Institute, December 2020), available online.
23 Intersectionality is inquiry and praxis that seeks to understand how “race, class, gender, and similar systems of power are interdependent and mutually construct one another,” as well as how “intersecting power relations produce complex, interdependent social inequalities of race, class, gender, sexuality, nationality, ethnicity, ability and age.” See Patricia Collins, Intersectionality as Critical Social Theory (Durham, NC: Duke University Press, 2019), 144.
See also Sumi Cho, Kimberlé Williams Crenshaw, and Leslie McCall, “Toward a Field of Intersectionality Studies: Theory, Applications, and Praxis,” Signs: Journal of Women in Culture and Society 38, no. 4 (2013), available online.
24 Bureau of Labor Statistics, “Labor Force Statistics from the Current Population Survey Overview,” last updated March 24, 2020, available online.
25 For this analysis, we exclude individuals of all other racial groups.
26 We include multiracial Black Latinos with Afro-Latinxs because research suggests two trends: one, Latinos have a tendency to choose “whiteness,” or at the very least, not see themselves within the categories of Black and white. Second, Latinos who experience discrimination because of their skin color are less likely to identify as “white” in the race question, and more likely to identify as Black or “Other.” These two patterns, taken together, suggest that those individuals who select Black and Latino, regardless of the combination, have a reason for doing so. For more detail see Edward Telles, “Latinos, Race, and the U.S. Census,” The Annals of the American Academy of Political and Social Science 677, no. 1(2018): 153-164, available online; and Clara E. Rodríguez, Michael H. Miyawaki, and Grigoris Argeros, “Latino Racial Reporting in the US: To Be or Not to Be,” Sociology Compass 7, no. 5 (2013): 390-403, available online.
27 We do so in order to ensure a direct comparison between the Afro-Latinx and non-Hispanic Black populations.
28 We use the Current Population Survey (CPS) data on sex as a proxy for gender. The CPS asks respondents, “What is your sex?” and allows for “male” and “female” responses. We recognize that individuals’ sex and gender identities are complex, and that one’s gender identity may or may not be related to one’s sex. Due to the unavailability of gender identity questions, we use the word “women” to refer to females and “men” to refer to males.
29 Galdámez et al., Centering Black Latinidad.
30 Rob Valletta and Nathaniel Barlow, “The Prime-Age Workforce and Labor Market Polarization,” Federal Reserve Bank of San Francisco Economic Letters 2018-21 (September 2018), available online.
31 Despite aggregating 12 months worth of basic monthly samples into yearly data points, there is more volatility in the year-to-year data for Afro-Latino men and Afro-Latina women when compared to other groups. This is likely indicative of sample size issues with the CPS, and suggests that more and better quality data is needed to study the experiences of Afro-Latinxs in the labor force.
32 Hernández et al., “Latinas Exiting the Workforce”; Misael Galdámez and Gabriella Carmona, “All Work and No Pay: Unpaid Latina Care Work During the Pandemic” (Los Angeles, CA: UCLA Latino Policy and Politics Institute, September 8, 2022), available online.
33 David Burk and Joshua Montes, Factors Affecting the Labor Force Participation of People Ages 25 to 54 (Washington, DC: Congressional Budget Office, February 2018), available online.
34 OECD, “How Does Education Affect Employment Rates?” in Education at a Glance 2014: Highlights (Paris: OECD Publishing, 2014), available online.
35 Xu, “First Fired, First Hired?”
36 Christopher R. Tamborini and Andrés Villarreal, “Immigrants’ Employment Stability Over the Great Recession and Its Aftermath,” Demography 5, no. 58 (October 2021): 1867–1895, available online.
37 For some groups, however, unemployment rates may be lower for immigrants than for the U.S. born. One longitudinal study, for example, found that immigrant Latino men were more likely to be employed than second- and third-generation workers. For more detail, see Pia M. Orrenius and Madeline Zavodny, “Hispanics in the U.S. Labor Market: A Tale of Three Generations,” Federal Reserve Bank of Dallas Working Papers available online.
38 William E. Spriggs, “Black Unemployment Matters Just as Much as White Unemployment,” The New York Times, July 19, 2021, available online.
39 Couch and Fairlie, “Last Hired, First Fired?”
40 Wilson and Darity Jr., “Understanding Black-White Disparities in Labor Market Outcomes Requires Models That Account for Persistent Discrimination and Unequal Bargaining Power;” and Cajner et al., “Racial Gaps in Labor Market Outcomes in the Last Four Decades and Over the Business Cycle.”
41 Kirshenman and Neckerman, “’We’d Love to Hire Them But…’”
42 Holder and Aja, “Afro-Latinxs in the U.S. Economy.”
43 Armagan Gezici and Ozge Ozay, “An Intersectional Analysis of COVID-19 Unemployment,” Journal of Economics, Race, and Policy 3 (2020): 270-281, available online.
44 Appendix 5 provides the results of empirical modeling work using data from the COVID-19 economic downturn. While the results show statistically significant differences in the likelihood of unemployment between the above racial and ethnic groups, tests of statistical significance between non-reference groups were inconclusive.
45 Orrenius and Zavodny, “Hispanics in the U.S. Labor Market: A Tale of Three Generations.” Immigrants are also more likely to experience employment instability than their U.S.-born peers. See also Tamborini and Villarreal, “Immigrants’ Employment Stability Over the Great Recession and Its Aftermath.”
46 Livia Lam, “A Design for Workforce Equity,” Center for American Progress, October 16, 2019, available online.
47 Federal Register, “Initial Proposals for Updating OMB’s Race and Ethnicity Statistical Standards,” January 27, 2023, available online.
48 Notably, the CPS has not yet adopted the changes to race and ethnicity data collection proposed by the OMB.
49 Jonathan Schwabish and Alice Feng, “Combining Racial Groups in Data Analysis Can Mask Important Differences in Communities,” Urban Institute, March 2021, available online; and Federal Committee on Statistical Methodology, “2023 FCSM Research and Policy Conference”, accessed January 24 2024, available online.
50 Galdámez et al., Centering Black Latinidad.
51 Sean Moulton, “Dollars and Demographics: How Census Data Shapes Federal Funding,” Project on Government Oversight, September 13, 2023, available online.
52 For more details on the inclusion of street race in survey instruments, see Cecilia Nuñez, Julia Silver, Misael Galdámez, and Nancy López, Latino is Not a Race: Understanding Lived Experiences Through Street Race (Los Angeles, CA: UCLA Latino Policy and Politics Institute, August 2024), available online.
53 Ibid.
54 “We note that the revised SPD 15 does not prohibit agencies from asking additional questions related to race, ethnicity, ancestry or other related concepts (Federal Register, Vol. 89, No. 62/Friday, March 29, 2024, Office of Management and Budget, Revisions to OMB’s Statistical Policy Directive No. 15: Standards for Maintaining, Collecting, and Presenting Federal Data on Race and Ethnicity, p. 22190).” See “Consensus Memo Responding to Initial Proposals for Updating OMB’s Race & Ethnicity Statistical Standards (Federal Register 2023-01635), available online.
See also “Necessary Research for Revising OMB’s Race and Ethnicity Standards” (Federal Register 2023-01635, Comment ID OMB-2023-0001-19545), available online.
55 U.S. Equal Employment Opportunity Commission, “Overview,” accessed January 16, 2024, available online.
56 William M. Rodgers III, “Race in the Labor Market: The Role of Equal Employment Opportunity and Other Policies,” The Russell Sage Foundation Journal of the Social Sciences 5, no. 5 (December 2019): 198-220, available online.
57 Danyelle Solomon, Connor Maxwell, and Abril Castro, “Systematic Inequality and Economic Opportunity,” Center for American Progress, August 7, 2019, available online.
58 Carmen Sanchez-Cumming, The Importance of Anti-Discrimination Enforcement for a Fair and Equitable U.S. Labor Market and Broadly Shared Economic Growth (Washington, DC: Washington Center for Equitable Growth, December 2021), available online.
59 Quillian et al., “Meta-Analysis of Field Experiments Shows No Change in Racial Discrimination in Hiring Over Time.”
60 U.S. Equal Employment Opportunity Commission, “What You Should Know: The EEOC’s Fiscal Year 2018 Highlights,” accessed January 16, 2024, available online.
61 Solomon et al., “Systematic Inequality and Economic Opportunity.”
62 Hernández, Racial Innocence.
63 Paige Smith and J. Edward Moreno, “State Anti-Bias Agency, EEOC Budgets Shift as Workloads Persist,” Bloomberg Law, September 1, 2022, available online.
64 National Employment Law Project, A State Agenda for America’s Workers: 18 Ways to Promote Good Jobs in the States (New York, NY: National Employment Law Project, December 2018), available online.
65 Terri Gerstein and LiJia Gong, The Role of Local Government in Protecting Workers’ Rights (Washington, DC and Cambridge, MA: Economic Policy Institute, Harvard Law School Labor and Worklife Program, and Local Progress Economic Policy Institute, June 13, 2022), available online.
66 Terri Gerstein and LiJia Gong, “How Local Governments Are Advancing Workers’ Rights, and Why Even More Should Get Involved,” Route Fifty, June 28, 2022, available online.
67 Michelle Alexander, The New Jim Crow: Mass Incarceration in the Age of Colorblindness (New York, NY: New Press, 2011).
68 Nazgol Ghandnoosh, One in Five: Ending Racial Inequity in Incarceration (Washington, DC: The Sentencing Project, October 2023), available online.
69 E. Ann Carson and Rich Kluckow, “Prisoners in 2022—Statistical Tables,” U.S. Department of Justice, Bureau of Justice Statistics, November 2023, available online.
70 Harry Holzer, Paul Offner, and Elaine Sorensen, “Declining Employment among Young Black Less Educated Men: The Role of Incarceration and Child Support,” Journal of Policy Analysis and Management 24, no. 2 (March 2005): 329-350, available online.
71 Ghandnoosh, “One in Five: Ending Racial Inequity in Incarceration.”
72 Darrell Steffensmeier and Stephen Demuth, “Ethnicity and Judges’ Sentencing Decisions: Hispanic-Black-White Comparisons,” Criminology 39, no. 1 (March 2006): 145-178, available online; Marisa Omori and Nick Petersen, “Institutionalizing Inequality in the Courts: Decomposing Racial and Ethnic Disparities in Detention, Conviction, and Sentencing,” American Society of Criminology 58 (July 2020): 678-713, available online; and Oshea Johnson, Marisa Omori, and Nick Petersen, “Racial-Ethnic Disparities in Policy and Prosecutorial Drug Charging: Analyzing Organizational Overlap in Charging Patterns at Arrest, Filing, and Conviction,” Journal of Research in Crime and Delinquency 60, no. 2 (2023): 255-299, available online.
73 Nick Petersen, Marisa Omori, Robert Cancio, Oshea Johnson, Rachel Lautenschlager, and Brandon Martinez, Unequal Treatment: Racial and Ethnic Disparities in Miami-Dade Criminal Justice (Miami, FL: Florida ACLU, July 2018), available online.
74 UCLA Latino Policy and Politics Institute, “Latino Criminal Justice Policy Priorities,” UCLA Latino Policy and Politics Institute, March 18, 2022, available online.
75 One study found that 43% of the growth of Black-white employment gaps between 1960 and 2010 was due to Black individuals’ higher likelihood of incarceration. See Patrick Bayer and Kerwin Kofi Charles, “Divergent Paths: A New Perspective on Earnings Differences Between Black and White Men Since 1940” (Chicago, IL: Becker Friedman Institute, July 2018), available online.
76 Ram Subramanian, Lauren-Brooke Eisen, Taryn Merkl, Leily Arzy, Hernandez Stroud, Taylor King, Jackie Fielding, and Alia Nahra, A Federal Agenda for Criminal Justice Reform (New York City, NY: Brennan Center for Justice, December 2020), available online.
77 Jessica Eaglin and Danyelle Solomon, Reducing Racial and Ethnic Disparities in Jails (New York City, NY: Brennan Center for Justice, June 2015), available online.
78 Representative David J. Trone, “H.R.1598 – 117th Congress (2021-2022): Workforce Justice Act of 2021,” Legislation, May 18, 2021, available online.
79 Although there is mixed evidence about the effectiveness of Ban the Box policies depending on the sector (e.g., private vs. public), we argue that policies that aim to reduce employment discrimination should continue to be tested and studied. See Steven Raphael, “The Intended and Unintended Consequences of Ban the Box,” Annual Review of Criminology no. 4 (2021):191–207, available online.
80 Christina Stacy and Mychal Cohen, Ban the Box and Racial Discrimination (Washington, DC, Urban Institute, February 2017), available online.
81 Grant Duwe and Makada Henry-Nickie, A Better Path Forward for Criminal Justice: Training and Employment for Correctional Populations (Washington, DC: Brookings Institution, April 2021, available online.
82 Maxine Baca Zinn and Ruth Enid Zambrana, “Chicanas/Latinas Advance Intersectional Thought and Practice,” Gender & Society 33, no. 5 (June 2019): available online.
83 Gina Ann García, Transforming Hispanic-Serving Institutions for Equity and Justice (Baltimore, MD: Johns Hopkins University Press, 2023), p. 150.