


Who’s Coming Home? An Analysis of the Property Sales, Permits, and Rebuilding Efforts of Single-Family Homeowners in Altadena, CA After the Eaton Fire
Acceda al informe en español aquí.
Executive Summary
This data brief is the first in a series that will examine racial equity in post-disaster housing recovery in Altadena, California. Both the Palisades and Eaton Fires devastated Los Angeles County in January 2025. We focus on Altadena, where the Eaton Fire caused the greatest damage to single-family homes, as a case study of disaster recovery and racial equity.
We analyzed property sales, permitting records, and rebuilding activity from February to August, 2025 to examine the progress made in wildfire recovery with a focus on whether racial disparities are emerging in who can rebuild and who is leaving the area altogether. We found that as of August 2025, a large majority of single-family homeowners whose homes sustained severe fire damage had not begun the recovery process, indicating considerable barriers to rebuilding. On the other hand, only a few homeowners have chosen to leave the community, and a small share have applied for construction permits. Simultaneously, early signs show some worrying patterns: Black homeowners were the most likely to see their homes severely damaged; most families with destroyed homes haven’t yet been able to take any steps toward recovery; and investors already make up most of the buyers of fire-damaged properties. These trends raise a bigger question for Altadena’s future: will long-time Black, Latino, and Asian homeowners be able to rebuild and stay, or will financial barriers and investor activity widen existing gaps in wealth and housing?
Key Findings:
1. Black homeowners in Altadena face the steepest hurdles to rebuilding after the Eaton Fire. Nearly six in 10 Black-owned homes sustained severe fire damage, a higher rate than white-, Latino-, or Asian-owned homes.
2. Fewer than one in ten homeowners in Altadena whose homes were severely damaged in the Eaton Fire had sold or listed their home as of August 31, 2025, with no significant differences observed among racial and ethnic groups.
3. Investors have purchased two-thirds of the single-family homes sold with severe fire damage. Most of these homes were previously owned by white households, with relatively few sales from Black, Latino, or Asian homeowners.
4. About one in four owners of severely fire-damaged Altadena homes have filed permit applications to rebuild in the aftermath of the Eaton Fire, with notable racial and ethnic differences in the types of permits being pursued. Black homeowners were most likely to apply for like-for-like permits (73%), while Latino homeowners stood out for temporary housing permit applications (11%).
5. Over half of rebuilding permit applications advanced through planning entitlements, but many remain on hold. Approximately 54 percent of permit applications have been cleared by the planning department, and an additional 28 percent are currently on hold.
6. Seven in ten homeowners with severely fire-damaged Altadena homes remain in a holding pattern, having taken no observable action in recovery. This trend is consistent across all racial and ethnic groups, though Black (73 percent) and Asian (71 percent) homeowners are more likely than others to have taken no action.
Background
In January 2025, California endured one of the most destructive wildfire events in its history. Over just three weeks, the Palisades and Eaton Fires burned more than 37,000 acres and damaged or destroyed over 18,000 structures. While the Palisades Fire had the most significant footprint, covering nearly 23,500 acres,1 the Eaton Fire caused far greater property damage, destroying almost 10,500 structures in the denser foothill communities of the San Gabriel Valley, especially in Altadena.2
Altadena’s recovery is especially significant since it serves as a case study in how climate disasters intersect with race, homeownership, and equity. Nearly half of those living in the burn area at the time of the Eaton Fire were people of color: 27 percent were Latino, 18 percent were Asian, and 7 percent were Black.3 Altadena became a haven for families of color decades ago, when housing across Los Angeles was more affordable, but racial discrimination kept many neighborhoods out of reach.4 Before the Eaton Fire, Black, Latino, and Asian households in Altadena owned their homes at nearly twice the countywide rate—with 74 percent of Black households, 61 percent of Latino households, and 72 percent of Asian households owning their homes.5 In the last decade, however, Altadena’s housing costs have soared, fragmenting its once-strong Black community and leaving many residents financially strained even before the fire.6 Nearly one in five residents lived below twice the federal poverty line, and Latinos made up 44 percent of those experiencing the greatest financial need.7
Recovery efforts cannot be understood without examining how longstanding racial and economic inequalities shaped residents’ vulnerability to the fire itself. Decades of segregation, environmental racism, and disparities in home values have pushed low-income residents and communities of color across the country into areas that are more vulnerable to natural hazards.8 The Eaton Fire burn area reflected that pattern. Black households were more likely to live inside the fire evacuation zone.9 Latino workers were concentrated in jobs that could not be done remotely, leaving them more vulnerable to lost wages during evacuation and cleanup.10 One in four Asian residents in the evacuation zone had limited English proficiency, creating barriers to receiving timely response information.11
Those same inequities may now be shaping recovery today. Previous wildfire disasters—from the 2023 Maui Fires to the 2021 Marshall Fire and the 2018 Camp Fire—have demonstrated that disaster recovery often exacerbates existing inequalities, with price spikes,12 underinsurance,13 and bureaucratic delays14 ultimately forcing economically vulnerable residents from their communities. Researchers call this outcome climate gentrification: when the very process of recovering from a climate disaster raises housing costs and displaces the residents most affected.15 Altadena is now showing many of the same warning signs. In January 2025, new rental listings surged to an average of 315 percent of fair market rent, more than double the legal cap, putting temporary housing out of reach for many displaced residents.16 While cleanup in both the Palisades and Eaton Fire zones was completed in a record eight months, homeowners have struggled with underinsurance and delayed payouts.17 These gaps, combined with delays in environmental testing, remediation, and construction costs, may keep residents in an expensive holding pattern and could eventually deter them from ever returning.18
To address barriers to recovery, Los Angeles County has implemented measures to reduce costs and expedite the rebuilding process. The Board of Supervisors approved permit fee waivers and refunds for owner-occupied single-family homes19 and created a streamlined permitting track for like-for-like rebuilds, which are projects where the replacement home is nearly identical in size, location, and use to what was lost (with slight increases allowed).20 Homeowners can also apply for permits to place temporary housing units, such as manufactured homes or RVs, on their property, or to build standalone Accessory Dwelling Units (ADUs) for interim use while a primary residence is reconstructed.21 While these steps aim to ease recovery, early evidence suggests that outcomes remain uneven and are deeply influenced by factors such as race, ownership status, and access to resources.
This brief builds on early evidence from recent wildfires to offer a focused, parcel-level snapshot of what recovery looks like in Altadena’s most affected neighborhoods. By capturing the first seven months of sales, permitting, and rebuilding patterns, this brief provides one of the earliest quantitative portraits of recovery in Altadena after the Eaton Fire.
Data and Methodology
About the Data
This analysis draws on several public data sources to track the recovery of single-family homeowners in Altadena following the Eaton Fire. Our study period spans from February 1 to August 31, 2025, covering the first seven months following the Eaton Fire.
We drew on parcel-level data from the Los Angeles County Assessor22 to examine initial property details,23 ownership, and sales history. To determine which homes were damaged, we relied on CAL FIRE’s Damage Inspection (DINS) program, which records the extent of fire damage for each property.24 For the purpose of this analysis, we predominantly focused on properties identified by the CAL FIRE’s DINS program as most severely impacted, 50 percent or more of their main structure destroyed.
To track recovery, we used the County’s EPIC-LA permitting system to identify rebuilding activity from February through August 2025;25 official sales records from February through August 2025, which we identified and validated using Property Reports from PropertyShark, an online real estate database and property research tool; and sales data from the Assessor’s office.26 To capture what might still be in the sales pipeline, we identified home sale listings included on Redfin, an online real estate brokerage, as of September 15, 2025.27
Together, these sources provide a comprehensive view of property damage, ownership, sales, and rebuilding efforts in Altadena’s fire zone.
Identifying the Race and Ethnicity of Pre-Fire Homeowners
To estimate the race and ethnicity of property owners prior to the Eaton Fire, we used a method called Bayesian Improved Surname Geocoding (BISG).28 This method considers two variables: a person’s last name and the racial and ethnic makeup of the neighborhood where they live.29 Because neighborhoods in the United States have historically been segregated, where someone lives can often provide important clues about their likely racial or ethnic identity.30 By combining these two pieces of information, BISG gives us a probability score showing how likely it is that a homeowner identifies as white, Black, Latino, Asian, Native American, or other race.31 For example, someone with the last name “Santos” living in a primarily Latino neighborhood would receive a higher probability score of being Latino than if that same name appeared in a predominantly white or Asian neighborhood.
Importantly, BISG does not provide certainty about a property owner’s identity. Instead, it generates probabilities, which we then use to construct our estimates. To make these estimates more stable, we ran a computer simulation 1,000 times for each last name, each time assigning race based on the probability scores.32 This produced 1,000 versions of our dataset, from which we calculated averages and ranges. These ranges (often referred to as “confidence intervals”) show how much our estimates vary due to the random assignment process. However, it is critical to note that while this procedure gives us a sense of precision, it does not address any underlying bias that may come from assigning a race through the BISG analysis.33 That’s because while this approach helps capture uncertainty in our estimates, especially important since our analysis is in smaller geographies, it does not correct for potential biases that may exist in the underlying Census data that BISG relies on.34 We report both the average estimate and the confidence interval for every data point (when disaggregated by race or ethnicity).
We also manually reassigned race and ethnicity to improve the accuracy of our racial and ethnic breakdowns. Properties owned by businesses (such as LLCs) were flagged and coded separately.35 In addition, we matched 529 households to GoFundMe pages created after the Eaton Fire, which provided self- and community-identified race and ethnicity for those families.36
Identifying Action Taken on the Property Pre-Fire Homeowners
To gauge recovery progress seven months after the Eaton Fire, we looked at the two main observable actions a homeowner could take after the fire:
- Selling the home or listing the home for sale, indicating a decision to leave
- Starting the process of rebuilding by filing a construction permit
Those who took neither action were identified as having not decided whether to leave or remain.
Classifying Homeowners Before and After the Fire
To better understand how ownership patterns may influence recovery, we categorized homeowners into two groups based on whether they owned their property before or after the Eaton Fire.
Pre-Fire Homeowners are those who maintained ownership of their property after the Eaton Fire. Within this group, we distinguished between:
- Individual owners, for whom race and ethnicity were estimated using BISG methods described above; and
- LLC owners, which include homes owned by Limited Liability Companies, corporations, or similar legal entities. We did not attempt to determine the nature of each business or whether its activities were directly related to real estate.
Post-Fire Homeowners are those who purchased their property between February 1 and August 31, 2025. We divided these buyers into:
- Non-Investors, which include individual buyers and family trusts not engaged in real-estate related business activity; and
- Investors, defined as LLCs, corporations, or family trusts registered under real estate-related professional categories (e.g. real estate investment, financial investment, construction or contracting, property sales or management, development and management of real estate, or holding companies that control other firms). We also considered buyers to be investors if they appeared to operate multiple LLCs under the same ownership or address, suggesting an umbrella investment structure.
A key distinction among pre- and post-fire owners is that while we treat pre-fire LLC owners as a single ownership category without inferring their purpose, we verified post-fire investor classifications through business registration searches and company information.37 This allows us to identify whether new purchases were made by investors or individuals likely intending to occupy the homes.
Key Findings
Our analysis provides a community-level snapshot of Altadena seven months after the Eaton Fire, with a specific focus on homes with 50 percent or more of their main structure destroyed. These are the homes most likely to be uninhabitable and in need of complete or near-full rebuilding before families can return. For the rest of this brief, we will refer to them as homes with severe fire damage. Out of more than 10,600 single-family homes we analyzed in Altadena (see Appendix Table A for full racial and ethnic makeup), nearly half (4,959) were identified by CAL FIRE’s Damage Inspection (DINS) as having 50 percent or more of their main structure destroyed from the Eaton Fire.
At a high level, the recovery picture in Altadena is marked by limited sales, modest rebuilding activity, and widespread inaction. Our analysis indicates that fewer than one in ten homeowners with severe fire damage have sold or listed their properties for sale. At the same time, approximately one in four homeowners with severe fire damage have initiated the rebuilding process by submitting a permit application. A majority of homeowners whose homes were severely fire-damaged– nearly seven in ten – have not yet taken any visible steps toward recovery, underscoring the uncertainty many families continue to face today.
These outcomes are not evenly distributed. Investor purchases dominate early sales of severely damaged properties. Latino homeowners appear more likely to have decided to pursue rebuilding, and Black homeowners carry the highest burden of severe damage from the fire.
In the key findings below, we present the data and disaggregated results by race, ethnicity, and ownership status to highlight potential inequities in recovery that may already be emerging.
1. Black homeowners in Altadena face the steepest hurdles to rebuilding after the Eaton Fire. Nearly six in 10 Black-owned homes sustained severe fire damage, a higher rate than white-, Latino-, or Asian-owned homes.
Figure 1 shows the percentage distribution of this severe fire damage by race, ethnicity, and LLC ownership. The fire severely damaged an estimated 59 percent of Black-owned homes, well above the overall average among all single-family homes and notably higher than the rates for white, Latino, Asian, or LLC-owned properties. LLC-owned properties were the least likely to sustain fire damage (38 percent). There was no difference in rates of severe fire damage among other racial and ethnic groups (see Appendix Table B for the full damage breakdown of all homes).
These findings mirror prior UCLA research, which showed that 58 percent of Black households in Altadena were located inside the fire perimeter, compared to 50 percent of non-Black households.38 Taken together, this means not only were Black households more likely to be in harm’s way, but when the fire did strike, their homes were also more likely to suffer the most severe levels of damage.
Figure 1. Share of Altadena Single-Family Homes with Severe Fire Damage, by Race, Ethnicity, and LLC status (August 2025)
Note: The 95% confidence interval indicates the margin of error surrounding our estimates in assigning race/ethnicity to homeowners using BISG. In Figure 1, the margins are small, indicating that the results are very likely to reflect the characteristics of the population.
Source: UCLA LPPI analysis of Los Angeles County Office of the Assessor, “Assessor Historical Parcel Data File”; and California Department of Forestry and Fire Protection, CAL FIRE Damage Inspection Program (DINS) database, accessed September 16, 2025, available online.
2. Fewer than one in ten homeowners in Altadena whose homes were severely damaged in the Eaton Fire had sold or listed their home as of August 31, 2025, with no significant differences observed among racial and ethnic groups.
As of August 2025, few homeowners with severe fire damage had chosen to leave Altadena, and overall sales remain consistent with pre-fire property turnover. Among single-family homeowners whose homes sustained severe fire damage, only about 5 percent had sold their homes by August 2025, and just 2 percent had listed their homes for sale on Redfin as of September 15 (Figure 2). Importantly, these levels of sales are similar to the previous year, indicating that turnover has not spiked and relatively few households have made the decision to leave Altadena.39
Sales patterns reveal no notable racial or ethnic differences in who has sold or listed properties. However, LLC-owned properties have been sold at much higher rates than other properties, with 10 percent sold compared to far lower levels among homeowners (Figure 2). These LLC properties, which were predominantly vacant land, sold for a median price between $565,000 and $614,000, with current listings in a similar range of $580,000 to $650,000. These prices are well below pre-wildfire levels, when homes were listed for over one million dollars on average.40 Post-wildfire prices were consistent across racial and ethnic groups, showing no significant differences in either sales or listings.
Figure 2. Share of Severely Fire-Damaged Altadena Homes Sold or Listed for Sale by Race, Ethnicity, and LLC Ownership (February to September 2025)
Note: The 95% confidence interval indicates the margin of error surrounding our estimates in assigning race/ethnicity to homeowners using BISG. For this figure, the margins are small, indicating that the results are very likely to reflect the characteristics of the population.
Source: UCLA LPPI analysis of California Department of Forestry and Fire Protection, CAL FIRE Damage Inspection Program (DINS) database, accessed September 16, 2025, available online; PropertyShark Property Reports; Los Angeles County Office of the Assessor, “Assessor Historical Parcel Data File”; and Redfin, “Altadena, CA homes for sale & real estate,” available online.
3. Investors have purchased two-thirds of the single-family homes sold with severe fire damage. Most of these homes were previously owned by white households, with relatively few sales from Black, Latino, or Asian homeowners.
Out of more than 10,600 single-family homes in Altadena, only 281 were sold between February 1 and September 15 2025 (see Appendix Table D for complete property sales data). Notably, nearly four-fifths of these sales (225 homes) were properties that suffered severe fire damage, underscoring how market activity has centered on these homes.
Among these 225 sales, investors have quickly emerged as the predominant buyers (Figure 3). Nearly two-thirds of these homes (145 homes) were purchased by 74 unique investors (see Appendix Table E for a list of the top five investors). These investors typically acquired more than one property in Altadena.
Figure 3. Number of Altadena Homes with Severe Fire Damage Purchased by Investors and Non-Investors (February to August 2025)
Note: Refer to the methodology section for the definition and approach used to identify investor-purchased properties.
Source: UCLA LPPI analysis of UCLA LPPI analysis of PropertyShark Property Reports; Los Angeles County Office of the Assessor, “Assessor Historical Parcel Data File”; Redfin, “Altadena, CA homes for sale & real estate,” available online; Biz Profile, “Online Directory of registered business entities in the United States,” accessed August 2025, available online; and California Secretary of State, “Business Search,” accessed August 2025, available online.
Figure 4 breaks down all 225 purchases by race, ethnicity, and LLC ownership of the original homeowners. We find that white homeowners previously owned a majority of these sold homes (about 59 percent). A significantly smaller number of homes were sold by racial minorities, indicating that investor activity has not yet involved substantial transfers of Black-, Latino-, or Asian-owned homes. Even so, the clear early trend is that investors are driving much of the property turnover in Altadena’s fire zone, a dynamic that could shape how the community rebuilds and who can return.
Figure 4. Estimated Share of Altadena Homes with Severe Fire Damage Sold by Race, Ethnicity, and LLC Ownership (February to August 2025)
Note: Percentages do not add up to 100% due to BISG probabilistic calculations. Additionally, about nine home sales with homeowners identified as “Other” race were removed due to high variability in estimates.
Source: UCLA LPPI analysis of UCLA LPPI analysis of PropertyShark Property Reports; Los Angeles County Office of the Assessor, “Assessor Historical Parcel Data File”; Redfin, “Altadena, CA homes for sale & real estate,” available online.
4. About one in four owners of severely fire-damaged Altadena homes have filed permit applications to rebuild in the aftermath of the Eaton Fire, with notable racial and ethnic differences in the types of permits being pursued. Black homeowners were most likely to apply for like-for-like permits (73%), while Latino homeowners stood out for temporary housing permit applications (11%).
Between February and September 2025, approximately 23 percent of homeowners whose homes sustained severe fire damage had taken the first step in rebuilding, with 1,215 filing a permit application with the County (Figure 5). 30 percent of Latino homeowners had filed an application, a rate significantly higher than that of other homeowners (20-24 percent). This suggests that Latino families with severe fire damage, despite other barriers they face, may be more likely to have decided to stay in Altadena.
Figure 5. Share of Homeowners of Severely Fire-Damaged Altadena Homes That Filed Construction Permits by Race, Ethnicity, and LLC Ownership (February to August 2025)
Note: The 95% confidence interval shows the margin of error around our estimates. For this figure, the intervals are relatively tight, meaning the shares are measured with reasonable accuracy. For interpretation, any intervals that overlap across any racial and ownership group indicate that the small differences observed are not statistically significant.
Source: UCLA LPPI analysis of California Department of Forestry and Fire Protection, CAL FIRE Damage Inspection Program (DINS) database, accessed September 16, 2025, available online; and Los Angeles County Planning, EPIC-LA, February 2025-August 2025, available online.
Through County permit applications, homeowners can apply for one of three main permit types: temporary housing, like-for-like rebuilds, and non-like-for-like rebuilds. Like-for-like rebuilds let homeowners reconstruct their home almost exactly as it was, with only minor modifications allowed.41 Non-like-for-like rebuilds involve significant changes to the original house, triggering compliance with current zoning and community requirements.42 Regardless of the rebuilding option, a homeowner can also submit an additional application to permit temporary housing, which would allow homeowners to place a pre-manufactured home, RV, mobile homes, or similar units on their property for short-term shelter during rebuilding.43
Among the permit applications for severely damaged homes, like-for-like construction has emerged as the dominant pathway. As shown in Figure 6, which breaks down permit applications by their three main categories, 68 percent of all homeowner permits were for a like-for-like rebuilds and 27 percent were for non-like-for-like rebuilds. Additionally, only about 7 percent of these homeowners opted to file for temporary housing on their property.
Among racial and ethnic groups, permit application patterns reveal how recovery is unfolding. Latino homeowners stand out for applying for temporary housing permits at a rate of more than 11 percent, a higher share than any other group, suggesting a strategy of securing housing stability on their property while longer-term plans are being developed for their rebuilds. By contrast, Black and white homeowners’ permit applications were the most likely to be for like-for-like rebuilding, with rates above 70 percent. Non-investor buyers, who entered the community after the fire, followed a different trajectory altogether: 47 percent of investors and 57 percent of non-investors with permit applications chose non-like-for-like construction, reflecting an interest in expanding or redesigning properties.
Figure 6. Share of Homeowners with Severely Fire-Damaged Homes in Altadena Filing Different Permit Application Types by Race, Ethnicity, and Ownership (February to August 2025)
Note: Percentages across bar charts for different racial and ethnic groups do not add up to 100% due to overlap in temporary permits with like-for-like or non-like-for-like permits and variance created through estimated racial classifications. Additionally, 5 percent of permits did not fall into these categories at all, as they were for disaster renovations or SB9 lot splitting.
Source: UCLA LPPI analysis of Los Angeles County Office of the Assessor, “Assessor Historical Parcel Data File”; and Los Angeles County Planning, EPIC-LA, February 2025-August 2025, available online.
5. Over half of rebuilding permit applications advanced through planning entitlements, but many remain on hold. Approximately 54 percent of permit applications have been cleared by the planning department, and an additional 28 percent are currently on hold.
To understand how homeowners have progressed through the recovery process, it is important to note the distinct journey they have undergone in Los Angeles County’s fire-recovery permitting process (Figure 7). This analysis draws on permit data from February through August 2025, which includes applications submitted under the County’s Recovery (CREC) track. In response to the urgency of rebuilding after the fire, the County consolidated agency review under a single, multi-department application: homeowners filed one permit that moved through Planning, Building & Safety, Fire, and Public Health.
Along the CREC application, different statuses appear on the permit application, marking key junctures in the process. A “New” status signals a successfully submitted County Recovery application.44 Planning then conducts the first review and typically update the status to “Waiting for Applicant” when comments or corrections are required. “In Review” is then used only for later rounds, as applicants resubmit materials for additional review. Once Planning approves the plans, the permit advances to either “Hold” if structural drawings or construction calculations are still missing or to “Open” which indicates that it has been sent to Building & Safety and subsequent departments for review. Finally, “Approved” means the permit has been issued and the project is ready to begin.
Since the time of this analysis, the County has transitioned to the County Disaster Recovery Permit – Rebuild Project (CREB) application system. The CREB process further integrates departments and simplifies coordination, introducing updated statuses that replace several used under the legacy CREC system. These changes do not affect the analysis here, as all permit records available at the time of data collection were processed under CREC.
Figure 7. Steps and Statuses in the LA County CREC Disaster Recovery Permit Application Process
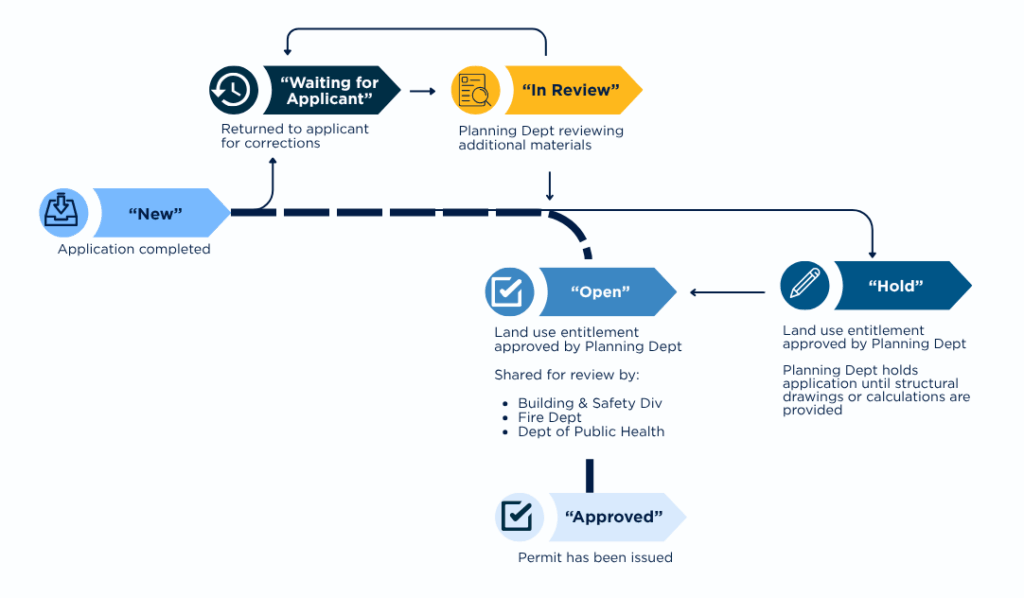
Source: Created by UCLA LPPI authors, based on internal research and conversation with LA County Planning Department Disaster Recovery Staff.
Homeowners with severely fire-damaged homes who have moved forward with the CREC permit applications generally made it through the initial planning and entitlements phases, but many have gotten stuck in the construction and technical review stages. Figure 8 breaks down rebuilding permits by status for all single-family homes with severe fire damage. There were no significant racial or ownership differences in how applicants were moving through the system. As of August 2025, the most common status among these permits was “Open” (54 percent), indicating that projects cleared planning and had proceeded to Building & Safety for interdepartmental clearance. However, the next most common status was “Hold” (28 percent), which signals that Planning cleared the project, but the project could not advance because it missed crucial technical construction documents.
In practice, a status of “Hold” likely indicates that a household is still securing the necessary financial and technical support to take the next step. Some owners may struggle to secure architects or engineers to prepare the required documents, while others may be held back by uncertainty about how they will finance their rebuilds.
Taken together, these permit statuses indicate that most households are overcoming the initial hurdles of permitting, but many remain at a stage where financing, insurance, and technical support intersect. Recovery and rebuilding are not simply about the willingness to rebuild but about access to resources, expertise, and financial clarity.
Figure 8. Permit Status for Altadena Homes with Severe Fire Damage Due to the Eaton Fire (February to August 2025)
Source: UCLA LPPI analysis of Los Angeles County Office of the Assessor, “Assessor Historical Parcel Data File”; and Los Angeles County Planning, EPIC-LA, February 2025-August 2025, available online.
6. Seven in ten homeowners with severely fire-damaged Altadena homes remain in a holding pattern, having taken no observable action in recovery. This trend is consistent across all racial and ethnic groups, though Latino homeowners are more likely than others to have taken some action.
Roughly 70 percent of all severely fire-damaged homes in Altadena remain in limbo, with no permit filed and no sales recorded. There are minor but significant differences among racial and ethnic groups, with Black (73%) homeowners the most likely to have taken no action, compared to Latino (65%) and LLC (65%) homeowners, who were the least likely to have taken no action. The overall lack of movement underscores that a large majority of families remain in a holding pattern.
This widespread inaction could reflect several realities. Many households may not yet be in the right frame of mind to make a firm decision about whether to stay or leave. Some may still be waiting on insurance settlements; a June 2025 survey found that 39 percent of respondents had received only partial payments, while 17 percent had no coverage at all, with Black and Latino households more than twice as likely as white households to lack insurance.44 Still others could be searching for alternative financial resources to rebuild, weighing options such as disaster relief funding, Southern California Edison’s proposed compensation program, or construction loans to bridge unexpected cost gaps.45 With reconstruction costs now averaging $500-$700 per square foot compared to $300-$400 before the fire, even well-prepared families may find themselves short of what is needed to move forward.46
Figure 9. Share of Homeowners with Severely Fire-Damaged Altadena Homes that Have Taken No Observable Action by Race, Ethnicity, and LLC Ownership (February to September 2025)
Note: The 95% confidence interval shows the margin of error around our estimates. For this figure, the intervals are relatively tight, meaning the shares are measured with reasonable accuracy. For interpretation, any intervals that overlap across any racial and ownership group indicate that the small differences observed are not statistically significant.
Source: UCLA LPPI analysis of California Department of Forestry and Fire Protection, CAL FIRE Damage Inspection Program (DINS) database, accessed September 16, 2025, available online; PropertyShark Property Reports, Los Angeles County Office of the Assessor, “Assessor Historical Parcel Data File”; Redfin, “Altadena, CA Homes for Sale & Real Estate,” available online; and Los Angeles County Planning, EPIC-LA, February 2025-August 2025, available online.
Conclusion
This data brief is the first in our series focused on post-fire recovery in Altadena, CA, we combined property sales records and listings, permit application data, and fire damage assessments to create a snapshot of how Altadena homeowners are faring seven months after the Eaton Fire. This approach enabled us to track who has sold, who is rebuilding, and who has yet to take visible steps toward recovery among homeowners whose properties were most severely damaged by the fires.
At a community level, the picture is mixed. Only a small share of homeowners with the most significant fire damage have relocated; as of August 31, 2025, about 5 percent of severely damaged homes had been sold, and just 2 percent were listed for sale by mid-September. About one in four (23 percent) have filed permits to rebuild, with Latino homeowners standing out at 30 percent compared to 20-24 percent among other groups. Still, the majority—nearly seven in ten severely damaged homes—show no observable recovery action.
It is this last group that raises the biggest questions. Nearly seven in ten homeowners with severely damaged homes have taken no publicly observable steps toward recovery, yet little is known about who they are or what challenges they face. Understanding their circumstances—whether stalled by insurance delays, financial barriers, or uncertainty about long-term decisions—is essential to grasping the trajectory of recovery. These unanswered questions will be the focus of future work in this series as we piece together the experiences of the households most affected.
Appendix.
Table A. BISG-Estimated of Altadena Single-Family Homeowners Compared to 2020 Census Homeownership Rates by Race, Ethnicity, and LLC Ownership
Note: 2020 Census homeownership rates include Duplex, Townhomes, and Apartment homeownership, which is not included in the Single-Family Homeowner dataset analyzed for this report.
Source: LPPI analysis and U.S. Census Bureau, “H4J: Tenure (Black or African American Alone, Not Hispanic or Latino Householder, Altadena CDP, California)” accessed September 22, 2025, available online; U.S. Census Bureau, “H4H: Tenure (Hispanic or Latino Householder, Altadena CDP, California),” accessed September 22, 2025, available online; U.S. Census Bureau, “H4L: Tenure (Asian Alone, Not Hispanic or Latino Householder, Altadena CDP, California),” accessed September 22, 2025, available online; U.S. Census Bureau, “H4I: Tenure (White Alone, Not Hispanic or Latino Householder, Altadena CDP, California),” accessed September 22, 2025, available online; U.S. Census Bureau, “H4N: Tenure (Some Other Race Alone, Not Hispanic or Latino Householder, Altadena CDP, California),” accessed September 22, 2025, available online; U.S. Census Bureau, “B25003: Tenure (Altadena CDP, California),” accessed September 22, 2025, available online.
Table B. Share and Degree of Fire Damage to Altadena Single-Family Homes, by Homeowner Race, Ethnicity, and LLC status (September 15, 2025)
Note: The 95% confidence intervals are reported within parentheses for each statistic, indicating that we can be 95% sure the actual value falls within the reported range.
Source: UCLA LPPI analysis of Los Angeles County Office of the Assessor, “Assessor Historical Parcel Data File”; and California Department of Forestry and Fire Protection, CAL FIRE Damage Inspection Program (DINS) database, accessed September 16, 2025,available online
Table C. Share of Altadena Single-Family Homes with Publicly Observable Recovery Actions (February to Sept 2025), by CAL Fire Reported Damage Level
Source: UCLA LPPI analysis of PropertyShark Property Reports, Los Angeles County Office of the Assessor, “Assessor Historical Parcel Data File”; Redfin, “Altadena, CA Homes for Sale & Real Estate,” available online; and Los Angeles County Planning, EPIC-LA, February 2025-August 2025, available online.
Table D. Sold Altadena Single Family Homes Purchased by Investors and Non-Investors by DIN Damage Level (February to August 2025)
Note: Refer to the methodology section for the definition and approach used to identify investor-purchased properties.
Source: UCLA LPPI analysis of UCLA LPPI analysis of PropertyShark Property Reports; Los Angeles County Office of the Assessor, “Assessor Historical Parcel Data File”; Redfin, “Altadena, CA Homes for Sale & Real Estate,” available online; Biz Profile, “Online Directory of registered business entities in the United States,” accessed August 2025, available online; and California Secretary of State, “Business Search,” accessed August 2025, available online.
Table E. Top 5 Investors in Significantly Damaged Properties in Altadena and the Number of Properties Owned (February to August 2025)
Source: UCLA LPPI analysis of PropertyShark Property Reports, Los Angeles County Office of the Assessor, “Assessor Historical Parcel Data File”; and Redfin, “Altadena, CA Homes for Sale & Real Estate,” available online.
End Notes
1 California Department of Forestry and Fire Protection, “Palisades Fire,” accessed September 11, 2025, available online.
2 California Department of Forestry and Fire Protection, “Eaton Fire,” accessed September 11, 2025, available online.
3 Chhandara Pech, Silvia R. González, and Albert Kochaphum, “Wildfires and Latino Communities: Health, Economic, and Preparedness Challenges” (UCLA Latino Policy & Politics Initiative, University of California Los Angeles, Los Angeles, January 2025), available online.
4 Paul Ong, Chhandara Pech, Lorrie Frasure, Samyu Comandur, Eric Lee, and Silvia R. González, “LA Wildfires: Impacts on Altadena’s Black Community” (Ralph J. Bunche Center for African American Studies, University of California Los Angeles, Los Angeles, January 2025), available online.
5 U.S. Census Bureau, “H4J: Tenure (Black or African American Alone, Not Hispanic or Latino Householder, Altadena CDP, California)” accessed September 11, 2025, available online.; U.S. Census Bureau, “H4J: Tenure (Black or African American Alone, Not Hispanic or Latino Householder, Los Angeles County, California)” accessed September 11, 2025, available online.; U.S. Census Bureau, “H4H: Tenure (Hispanic or Latino Householder, Altadena CDP, California),” accessed September 11, 2025, available online.; U.S. Census Bureau, “H4H: Tenure (Hispanic or Latino Householder, Los Angeles County, California),” accessed September 11, 2025, available online.; U.S. Census Bureau, “H4L: Tenure (Asian Alone, Not Hispanic or Latino Householder, Altadena CDP, California),” accessed September 11, 2025, available online.; U.S. Census Bureau, “H4L: Tenure (Asian Alone, Not Hispanic or Latino Householder, Los Angeles County, California),” accessed September 11, 2025, available online.
6 Paul Ong, et al., “LA Wildfires: Impacts on Altadena’s Black Community.”
7 Paul M. Ong, Gabriella Carmona, Silvia R. González, Jonathan Ong, “Underserved and Overlooked: Understanding Pre-Fire Economic Inequality Among Residents in Altadena, California” (UCLA Latino Policy & Politics Initiative, University of California Los Angeles, Los Angeles, May 2025), available online.
8 Anna Cash, Karen Chapple, Nicholas Depsky, Renee Roy Elias, Melisa Krnjaic, Shazia Manji, and Honora Montano, Climate Change and Displacement in the U.S. – A Review of the Literature: Understanding the connections between climate change and displacement in U.S. communities and how they converge (Berkeley, CA: Strong, Prosperous, And Resilient Communities Challenge, April 2020), available online.
9 Paul Ong, et al. “LA Wildfires: Impacts on Altadena’s Black Community.”
10 Chhandara Pech, et al., “Wildfires and Latino Communities: Health, Economic, and Preparedness Challenges.”
11 Paul Ong, Chhandara Pech, Jonathan Ong, Melany De La Cruz-Viesca, Silvia R. González, and Bryzen Enzo Morales, “Asian American Language Needs in LA Wildfires” (Center for Neighborhood Knowledge, University of California Los Angeles, Los Angeles, February 2025), available online.
12 Nina Lakhani, “First came the Maui wildfires. Now come the land grabs: ‘Who Owns the Land is Key to Lahaina’s Future,’” The Guardian, March 15, 2024, available online.
13 J. Anthony Cookson, Emily Gallagher, Philip Mulder, “Coverage Neglect in Homeowners Insurance,” Social Science Research Network, 2024, available online.
14 Nicole Lambrou, Crystal Kolden, Anastasia Loukaitou-Sideris, “Disaster Recovery Gentrification in Post-Wildfire Landscapes: The Case of Paradise, CA,” International Journal of Disaster Risk Reduction 118 (2025), available online.
15 Joshua Thompson, Robert Wilby, John Hillier, Richenda Connell, Geoffrey Saville, “Climate Gentrification: Valuing Perceived Climate Risks in Property Prices,” Annals of the American Association of Geographers 113, no. 5 (2023): 1092-111, available online.
16 Lucy Briggs, Iris Craige, Alex Ferrer, Lauren Harper ,Nils Jepson, Chelsea Kirk, Philip Meyer, and Max Stein, After the LA Fires: Rent-Gouging in the Wake of Disaster (The Rent Brigade, January 2025), available online.
17 Andrè Coleman, “Eaton Fire Cleanup Outpaces Paradise, Mirrors Maui Recovery,” Pasadena Now, August 21, 2025, available online; Eaton Fire Survivors Network, “The State Farm Files Systemic Violations of Law After the Eaton and Palisades Fires,” updated August 1, 2025, available online.
18 As of September 11, 2025, there were 1,687 rebuild applications received from Eaton and 320 building permits issued or in other words only 19 percent. For more detail see, LA County Recovers, “Permitting Progress Dashboard,” accessed September 11, 2025, available online; Malia Yap, “Wildfire Survivors Still Face a Slow and Uncertain Return Home Months After the Fires,” Los Angeles Times, August 25, 2025, available online.
19 LA County Recovers, “Fee Waivers and Refunds,” accessed September 24, 2025, available online.
20 LA County Recovers, “Step 3: Start Your Permit Application,” accessed September 24, 2024, available online.
21 Ibid.
22 Los Angeles County Office of the Assessor, “Assessor Historical Parcel Data File,” accessed August 2025.
23 Starting with parcels in all of Los Angeles County, we filtered our dataset down to all unique parcels in Altadena and then used their land use codes (0100 and 0101), which are four-character codes that indicate whether the current, or anticipated, use of the property is a single-family residence.
24 California Department of Forestry and Fire Protection, “CAL FIRE Damage Inspection Program (DINS) Database,” accessed September 16, 2025, available online.
25 Los Angeles County Planning, EPIC-LA, “Public Information,” February 2025-August 2025, available online.
26 PropertyShark, Property Reports, accessed August 2025; Los Angeles County Office of the Assessor, “Assessor Historical Parcel Data File,” and Redfin, “Altadena, CA Homes for Sale & Real Estate,” available online.
27 Homes were counted as “on the market” if they were listed for sale on Redfin, “Altadena, CA Homes for Sale & Real Estate,” as of September 15, 2025, available online.
28 BISG is a statistical method that uses Bayesian probability, which means it doesn’t assign a single race or ethnicity but instead calculates the likelihood of belonging to different groups.
29 Neighborhood racial and ethnic data is based on U.S. Census block group counts of adult residents (ages 18+), which we used as a stand-in for local homeownership patterns. See U.S. Census Bureau, “P11: Hispanic or Latino, and Not Hispanic or Latino by Race for the Population 18 Years and Over (Block Groups, Los Angeles County, California),” accessed September 22, 2025, available online.
30 Carry McCartan, Robin Fisher, Jacob Goldin, Daniel Ho, and Kosuke Imai, “Estimating Racial Disparities When Race is Not Observed,” Journal of the American Statistical Association (2025): 1-14, available online.
31 The surname data comes from the U.S. Census Bureau, which tracks how common last names are across different racial and ethnic groups. See for more details, U.S. Census Bureau, “Census Surname Data,” accessed September 25, 2025, available online. Additionally, racial categories from the Census were predefined using the R library pack WRU. For more details, see R Project, “wru: Who Are You? Bayesian Prediction of Racial Category Using Surname and Geolocation,” accessed September 25, 2025, available online.
32 This “simulation” process is called bootstrapping. In each of the 1,000 runs, the race assignment is randomized according to the probability scores from BISG, producing a range of possible outcomes. See for more details of its application: Benjamin Lu, Jia Wan, Derek Ouyang, Jacob Goldin & Daniel E. Ho, “Quantifying the Uncertainty of Imputed Demographic Disparity Estimates: The Dual-Bootstrap,” (National Bureau of Economic Research, April 2024), available online.
33 The confidence intervals reported here are at the 95% level, a common standard in statistics that indicates we can be 95% sure the true value falls within the reported range.corporations
34 Biases from the Census data may come from the systemic undercounting or misclassification of certain populations and racial/ethnic groups in the United State. See for more details, EvaFebruaryn T. R. Rosenman, Santiago Olivella & Kosuke Imai, “Race and Ethnicity Data for First, Middle, and Surnames,” Scientific Data 10, no. 299 (2023), available online.
35 Business ownership was flagged by identifying Limited Liability Companies (LLCs) in the property records.
36 The GoFundMe dataset was compiled and verified by non-profits as part of community responses to the Eaton Fire and provides community racially-identified information on affected households. See for more details, “Displaced Black Families GoFundMe Directory,” accessed September 25, 2025, available online and “Displaced Latine Families – Wildfire Mutual Aid Directory,” accessed September 25, 2025, available online.
37 See for more details Biz Profile, “Online Directory of Registered Business Entities in the United States,” accessed August 2025, available online and California Secretary of State, “Business Search,” accessed August 2025, available online.
38 Paul Ong, et al. “LA Wildfires: Impacts on Altadena’s Black Community.”
39 Redfin, “Altadena, CA Homes for Sale & Real Estate: # of Homes Sold (All Home Types),” accessed September 30, 2025, available online.
40 Redfin, “Altadena, CA Homes for Sale & Real Estate: Median Sale Price (All Home Types),” accessed September 30, 2025, available online.
41 LA County Recovers, “Step 3: Start Your Permit Application,” accessed September 24, 2024, available online.
42 Ibid.
43 Ibid.
44 Department of Angels, “Survey of Wildfire-Impacted Areas,” updated June 2025, available online.
45 Southern California Edison, “Draft Released For Comment On September 17, 2025 Southern California Edison Wildfire Recovery Compensation Program for Compensation for Claims of Property Damage and Loss, Business Loss, Fatalities, and Physical Injury,” accessed September 25, 2025, available online.; Melody Petersen, “Edison Details How Much it Plans to Pay Eaton Fire Victims,” Los Angeles Times, September 18, 2025, available online.
46 Pasadena Now, “Navigating the Rebuilding Process After a Wildfire: What Homeowners Need to Know,” February 26, 2025, available online; David Brancaccio and Meredith Garretson Morbey, “A Group of Altadena Homeowners is Banding Together to Lower Rebuilding Costs,” Marketplace, June 5, 2025, available online.