


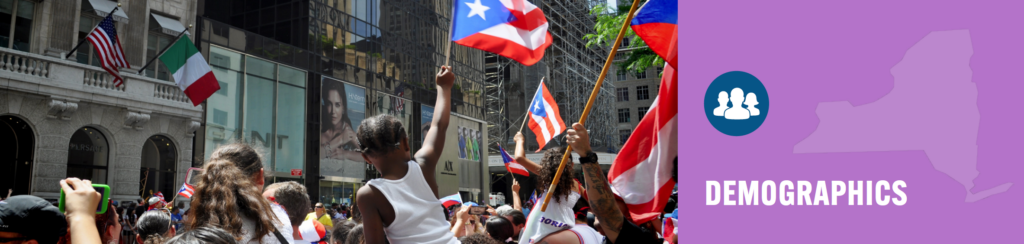
15 Facts About Latino Well-Being in New York
This data brief, produced by the UCLA Latino Policy and Politics Institute research team, provides detailed information on New York’s Latino population using the 2015-19 American Community Survey data.
1. Latinos are the second-largest racial and ethnic group in New York at 19% of the population, compared to 18% of the national share of Latinos. Since 2000, Latinos have grown the fastest compared to other major racial groups.
2. Latinos in New York are young. With a median age of 32, New York Latinos are the youngest among major racial groups and significantly younger than the average New Yorker (38). Roughly 17% of Latinos in New York are children ages 10 and under, compared to 14% of the state overall.
3. New York Latinos are diverse. While Latinos of Puerto Rican descent are the single largest group of Latinos (29%), no one descent group forms a majority (Figure 1). Dominicans (23%) and South Americans (16%) are the second- and third-largest groups respectively, while Guatemalans have grown the fastest since 2000. In contrast, U.S. Latinos are majority Mexican (62%).
Figure 1: New York Latino Population by Descent Group, 2019
Percent of Total New York Latino Population
Source: LPPI analysis of 2015-2019 5-Year American Community Survey public use microdata.
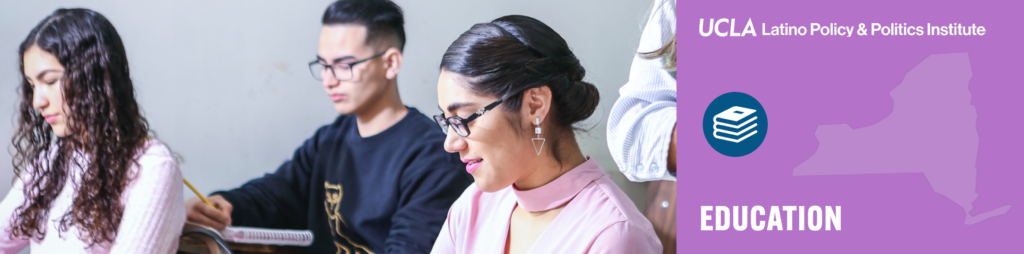
4. Almost a fifth of New York Latinos have completed a college degree or more (19%), 3 percentage points higher than the Latino national rate (16%). However, fewer Latinos have completed a bachelor’s degree compared to New Yorkers overall (37%).
5. Latinas have higher levels of education than Latino men. 21% of New Yorker Latinas completed a bachelor’s degree or higher, compared to just 17.3% of Latino men (Figure 2). Latino men have the lowest college completion rates among major racial groups in New York.
Figure 2: New York Population with a Bachelor’s Degree or Higher by Race, Ethnicity, and Gender, 2019
Source: LPPI analysis of 2015-2019 5-Year American Community Survey public use microdata.
6. Latino men have the highest labor force participation rate among men (Figure 3). 73% of Latino men participate in the workforce, compared to 70% of white men. Latinas have the third-highest labor force participation rate among women (60%), following Black women (61.4%) and white women (59.7%).
Figure 3: New York Labor Force Participation Rates by Race, Ethnicity, and Gender, 2019
Source: LPPI analysis of 2015-2019 5-Year American Community Survey public use microdata.
7. Despite their high propensity to work, median household incomes for Latinos in New York are only $48,600, almost $19,000 less than the state median ($68,000). Further, 29% of Latino households use the Supplemental Nutritional Assistance Program (SNAP)—the most of any group.
8. Almost half of Latinos in New York live in poverty or low-income conditions (Figure 4), a significantly higher rate than the state poverty and low-income rates (29.6%). Non-citizen Latinos are especially vulnerable—over half live below the poverty line or in low-income conditions (57%).
Figure 4. Household Poverty in New York by Race and Ethnicity, 2019
Source: LPPI analysis of 2015-2019 5-Year American Community Survey public use microdata.
Note: Race and ethnicity reflect the background of the head of household.
9. Latino children are more likely to live in poverty than other children in New York. 30% of Latino children live under the poverty line, and another 26% live in low-income conditions—a significantly higher rate than the state poverty and low-income rates for all children (20% and 19% respectively).

10. Only a quarter of Latinos in New York own their home, the lowest of all major racial and ethnic groups (Figure 5), less than the state (54%) and U.S. Latino homeownership rates (47%). Among the various Latino descent groups, Cuban New Yorkers are the most likely to own their homes (43%).
Figure 5. Homeownership Rates in New York by Race and Ethnicity, 2019
Source: LPPI analysis of 2015-2019 5-Year American Community Survey public use microdata.
11. Despite low homeownership rates, Latino median home values in New York are well above the state average. In 2019, Latinos’ median home values were $385,000—$85,000 more than the state median ($300,000).
12. Over half of New York Latinos (58%) are housing cost-burdened—meaning they spend more than 30% of their incomes on housing—a higher rate than the New York average (52%) and Latinos nationally (55%).
13. Latinos, especially Latino children, are very likely to live in overcrowded households. Twelve percent of Latino households and 32% of Latino children in New York are in overcrowded conditions, the second-highest rates (respectively) among major racial and ethnic groups.
14. More than one in ten Latinos in New York is uninsured (11%), almost double the state uninsured rate (6%), but lower than Latinos nationally (19%). Among Latino groups, more than a third of noncitizen Latinos are uninsured (34%). However, few Latino children are uninsured (2%), which is in line with the state uninsured rate for children (2%).
15. In 2019, 42% of Latinos and 61% of Latino children in New York were covered by Medicaid. Both Latinos overall and Latino children are more likely to be covered by Medicaid compared to the state average (26% for all New Yorkers and 42% for children).
Featured photo by Colton Duke on Unsplash.