


Post-pandemic Small Business Recovery Amid Economic and Credit Headwinds
Introduction
Small businesses in 2025 are operating in an economy that is markedly different from the height of the COVID-19 pandemic. While optimism over the health of the American economy grew after 2022 as COVID-19 receded,1 today, small business owners continue to face headwinds from inflation, tighter credit, tariffs, cuts to federal aid programs,2 and natural disasters that cloud future plans. This challenging financial environment follows an initial post-pandemic boom in business formation.
This data brief uses data from the U.S. Census Bureau’s Small Business Pulse Survey, the U.S. Bureau of Labor Statistics, and other federal sources to examine the trends of U.S. businesses before, during, and after the pandemic. The analysis focuses on Latino-owned businesses, their recovery trajectories, and ongoing challenges related to rising costs and access to capital.
Why Pandemic Trends Still Matter Now?
The trends documented here are not just a historical snapshot. They offer a critical lens for understanding the vulnerabilities small businesses carry into today’s challenging economy. COVID-19 exposed deep gaps in access to capital, disproportionate impacts on minority-owned firms, and the fragility of microbusinesses. Those weak points are again being tested by inflation, trade disruptions, labor uncertainty, tighter credit, and natural disasters.
Key Findings
Key Finding 1: Severe Initial Economic Shock with a Rapid Employment Rebound.
The 2020 COVID-19 Pandemic severely impacted the economy, causing a downturn not matched by any in the post-Great Depression era.3 This can be seen in the two most widely used measures of economic activities, the gross domestic product (GDP) and the unemployment rate (UR). During the pandemic, the national GDP fell by 9% in just two quarters (vs. 4% during the Great Recession over four quarters) and UR spiked from under 4% to 13% before returning to similar levels, illustrating the magnitude and speed of the shock and rebound.
Figure 1. U.S. Gross Domestic Product (GDP) Indexed, 2004–2024
Source: LPPI analysis of GDP data from the U.S. Bureau of Labor Statistics.
Figure 2. U.S. Unemployment Rate, 2004–2024
Source: LPPI analysis of Labor Force Statistics from the Current Population Survey data (CPS) from the U.S. Bureau of Economic Analysis.
Key Finding 2: Pandemic Recovery Remains Uneven.
Many small firms continue to face elevated costs for goods, wages, and financing. Early in the pandemic, 51% of firms reported a large negative effect and 39% a moderate effect (Figure 3). Two years later, the share reporting a “large negative” fell to 22%, but those citing a “moderate negative” remained nearly unchanged at 39%.
Figure 3. Share of Businesses Reporting Large or Moderate Negative Effects of COVID-19, 2020 and 2022
Source: LPPI analysis of the Small Business Pulse Survey from the U.S. Bureau of the Census.
Key Finding 3: Paradoxical Business Formation Trends.
The “small business boom” of 2020–2023 brought an unusual mix of high business creation and high turnover. There was no net loss in the number of businesses, and by some measures, a sparingly sizable increase.4 Establishments with employees remained essentially unchanged, from 7.17 million in 2019 to 7.19 million in 2021.5 This outcome was due to a number of factors that enabled many firms to continue. Programs such as the Paycheck Protection Program contributed to firm survival, although there are questions about whether the funds were most effectively distributed.6 These numbers, however, hide the underlying dynamics of firm creation and destruction, which is captured by the number of establishments with paid workers entering and leaving the economy. As shown in Figure 5, the number of exits exceeded the number of entrants during the 2008 Great Recession, which is the expected outcome of an economic downturn. During the pandemic, there was an increase in both categories, indicating a considerable amount of turmoil or churning. The increase was even greater when non-employee firms were included. Figure 6 shows a modest decline in business formation during the Great Recession (153-thousand between 2008 and 2009), but a sizable jump during the pandemic (854-thousand between 2019 and 2020, and over a million in the subsequent year).7 It appears that the pandemic disrupted the economy in ways that not only shuttered many businesses but simultaneously created opportunities for developing new businesses to match the changing way people live and consume.
Figure 5. Trends in Establishment Entry and Exit Rates in the United States, 2004–2021
Source: LPPI analysis of Business Dynamics Statistics (BDS) data from the U.S. Bureau of the Census.
Figure 6. Trends in Business Formation Rates in the United States, 2004–2021
Source: LPPI analysis of Business Formation Statistics (BFS) data from the U.S. Bureau of the Census.
Key Finding 4: Persistent Uneven Recovery.
The partial recovery documented by 2022 has since plateaued for many firms. For small businesses that survived COVID-19, recovery has shifted from regaining lost ground to adapting to a “new normal” in which costs remain structurally higher and credit is harder to secure, amongst other challenges. At the macro level, growth in employer establishments was essentially flat at 7.17 million in 2019 vs. 7.19 million in 2021 (Figure 5), highlighting how limited net gains were even before entering 2025’s uncertain economy.
Early in the pandemic, top short-term needs included hiring workers (40%), boosting revenues (25%), and finding new suppliers (25%) (Figure 4). Overall, the statistics show a diversity of needs, indicating that the pandemic had equally diverse impacts on business operations. By 2024, priorities had shifted toward stabilizing cash flow, with more than half of small firms drawing on personal funds to cover business expenses.8 This change in priorities emerged during a period of persistent inflation and tighter credit conditions.
Key Finding 5: Disproportionate Pandemic Impact on Latino-Owned Businesses
The rapid rebound in jobs after COVID-19 created the appearance of a full recovery, yet the underlying financial stability of small businesses remains fragile. Figure 7 provides evidence that Latino businesses (LOBs) were more likely to be harmed by the pandemic. In 2022, LOBs were 1.3 times as likely as all businesses—and 1.5 times as likely as non-Latino white—to have experienced a significant decline in sales.
As shown in Figure 8, they were also 1.5 times as likely as all businesses, and 1.7 times as likely as NHWs, to report financing needs. Latino appear to be considerably less likely to apply for financing. While half of LOBs with need did not apply, only two-fifths of all businesses did not. This is consistent with the greater barriers facing Latinos in accessing financial institutions. While LOBs received government assistance from programs such as Paycheck Protection Program, most studies find that minority businesses and communities benefited less.9 In today’s economy marked by macroeconomic headwinds, these vulnerabilities are being tested again.
Figure 7. Impact of the COVID-19 Pandemic on Sales, by Race and Ethnicity of Business Owners
Source: LPPI analysis of the Small Business Pulse Survey from the U.S. Bureau of the Census.
Figure 8. Additional Financing Needed in 2022, by Race and Ethnicity of Business Owners
Source: LPPI analysis of the Small Business Pulse Survey from the U.S. Bureau of the Census.
Latino-owned businesses entered the pandemic recovery period at a disadvantage, with higher financing needs and lower approval rates than other firms.10 These disparities persist today: Latino entrepreneurs remain about twice as likely as white counterparts to be denied full funding,11 despite Small Business Administration-backed loans to Latino-owned businesses nearly doubling between 2020 and 2023 to $3B.12 The rollback of federal programs such as the Minority Business Development Agency’s core services and equity-conscious contracting further reduces the policy tools available to close these gaps.
Key Finding 6: Resilience and Growth of LOBs, Despite Earnings Declines.
Despite longstanding systemic barriers and the disruptions of the pandemic, LOBs were pivotal in sustaining U.S. business counts during this period as the number of LOBs increased.13 From 2018 to 2022, the number of self-employed Latino entrepreneurs increased from 533,000 to 658,000, increasing their share of all self-employed from 16% to 19% (Figure 9).14 Without Latino entrepreneurs, total U.S. business counts would have declined during this period. This growth occurred despite post-pandemic earnings declines among LOBs (Figure 10).
Figure 9. Indexed Self-Employment Rates for Total, white, and Latino Workers (2018–2022, 2018=100%)
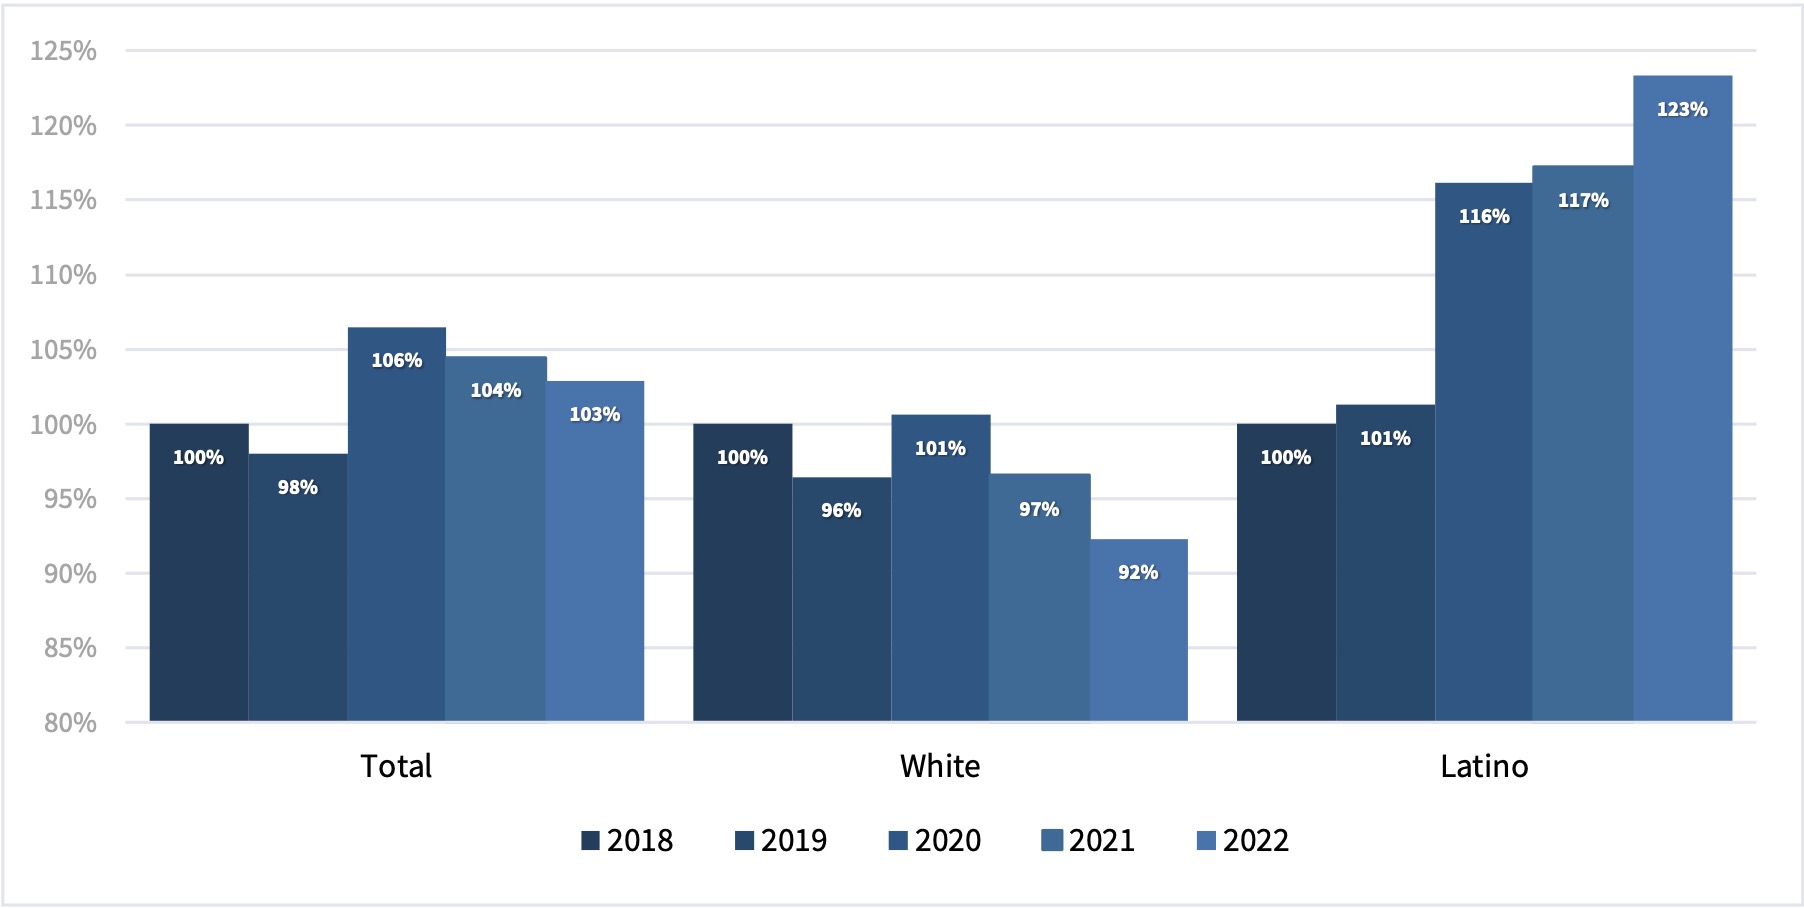
Note: Universe includes self-employed individuals ages 18–65. Latino reflect individuals of any race who self-identify as Latino, while white reflect the non-Latino white population. Self-employment refers to individuals who work for and own their own business, professional practice, or farm, regardless of business incorporation status. In this brief, self-employed and entrepreneurs are used interchangeably.
Source: LPPI analysis of American Community Survey Public Use Microdata Sample (PUMS) 2022 5-year files from the U.S. Bureau of the Census.
Figure 10. Indexed Earnings of Total, White, and Latino Workers (2018–2022, 2018=100%) 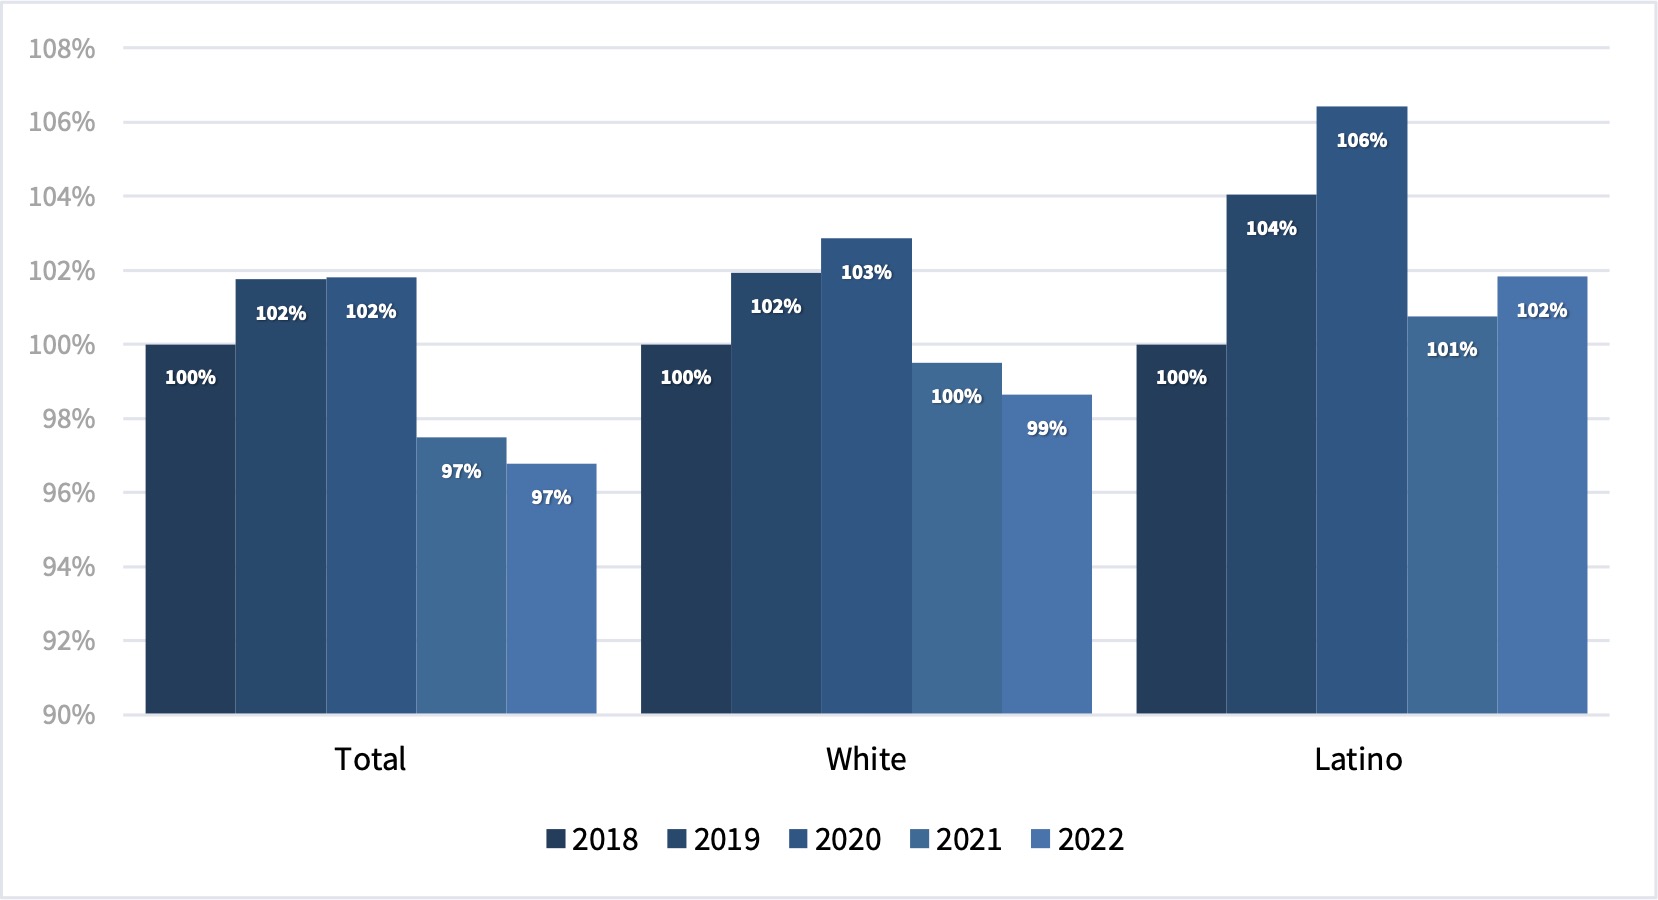
Note: The data is based on Question 42, which asks “Which one of the following best describes this person’s employment last week or the most recent employment in the past 5 years?” There are two options under the “SELF-EMPLOYED OR OTHER” category: “Owner of non-incorporated business, professional practice,” or “Owner of incorporated business, professional practice, or farm.” We also restrict the sample to those who worked in the year prior to the survey. In this brief, self-employed and entrepreneurs are used interchangeably.
Source: LPPI analysis of American Community Survey Public Use Microdata Sample (PUMS) 2022 5-year files from the U.S. Bureau of the Census.
Conclusion
The pandemic’s legacy is still shaping small business performance in 2025. While many firms rebounded quickly from the initial economic shock, the gains have proven fragile amid persistent cost pressures, volatile demand, limited access to affordable credit, and labor uncertainty. Latino-owned businesses, in particular, continue to face disproportionate financing barriers even as they drive small business counts nationally. The current policy environment presents both opportunities, such as targeted place-based investment and green business funding, and risks that undermine the contributions of small and Latino-owned businesses to the broader economy. These risks include federal rollbacks of the Minority Business Development Agency’s core services and court limits on equity-conscious contracting.
End Notes
1 U.S. Chamber of Commerce, “Small Business Index: How would you rate the overall health of the United States economy?,” Accessed August 11, 2025, available online.
2 MetLife & U.S. Chamber of Commerce Q2 2025 Small Business Index, June 25, 2025, available online. Fiserv Small Business Index, “Inflation and Tariff Impact Summary,” June 2025, available online.
3 The White House, “The U.S. Economy and the Global Pandemic,” April 23, 2022, available online. U.S. Census Bureau, “The Coronavirus Pandemic’s Economic Impact.” July 28, 2022, available online. Accessed September 8, 2024.
4 Haltiwanger, John C. “Entrepreneurship during the COVID-19 pandemic: Evidence from the business formation statistics.” Entrepreneurship and Innovation Policy and the Economy 1, no. 1 (2022): 9-42.
5 These numbers are based on the U.S. Census Bureau’s “Business Dynamics Statistics,” available online. Accessed September 8, 2024. This source “provides annual measures of business dynamics (such as job creation and destruction, establishment births and deaths, and firm startups and shutdowns) for the economy overall and aggregated by establishment and firm characteristics.” Establishments refers to a work site, and a firm can have one or more establishments. An alternative to the official statistics is discussed in Crane, Leland D., Ryan A. Decker, Aaron Flaaen, Adrian Hamins-Puertolas, and Christopher Kurz. “Business exit during the COVID-19 pandemic: Non-traditional measures in historical context.” Journal of macroeconomics 72 (2022): 103419.
6 William R. Emmons and Drew Dahl, “Was the Paycheck Protection Program Effective?”, Federal Reserve Bank of St. Louis, July 06, 2022, available online.
7 U.S. Census Bureau, “Business Formation Statistics,” available online.Accessed September 8, 2024.
8 Federal Reserve Banks, 2025 Report on Employer Firms: Findings from the 2024 Small Business Credit Survey, available online. Accessed September 9, 2024.
9 Fairlie, Robert, and Frank M. Fossen. “Did the Paycheck Protection Program and Economic Injury Disaster Loan Program get disbursed to minority communities in the early stages of COVID-19?.” Small Business Economics 58, no. 2 (2022): 829-842; Atkins, Rachel, Lisa Cook, and Robert Seamans. “Discrimination in lending? Evidence from the paycheck protection program.” Small Business Economics (2022): 1-23; Ong, Paul, Silvia R. Gonzalez, Rodrigo Domínguez-Villegas, Jonathan Ong, and Chhandara Pech. “Disparities in the Distribution of Paycheck Protection Program Funds in California’s Congressional Districts.” (2021).
10 Stanford Latino Entrepreneurship Initiative, 2020.State of Latino Entrepreneurship Report. available online.
11 Federal Reserve Bank of New York, 2021 Report on Firms Owned by People of Color: Findings from the 2020 Small Business Credit Survey, April 15, 2021, available online. Stanford Graduate School of Business, “A Decade of Data Shows Latino Entrepreneurs Are Growing and Adapting,” September 14, 2023, available online.
12 White House Archived Release, 2023. “Biden-Harris Administration Announces Record $3 Billion in Lending to Latino-Owned Small Businesses” , available online.
13 Statistics based on U.S. Census Bureau, “American Community Survey (ACS),” n.d., available online. We use the IPUMS USA version of the 2022 5-year files. Steven Ruggles, Sarah Flood, Matthew Sobek, Daniel Backman, Annie Chen, Grace Cooper, Stephanie Richards, Renae Rodgers, and Megan Schouweiler. IPUMS USA: Version 15.0 [ACS]. Minneapolis, MN: IPUMS, 2024. available online.
14 The data is based on Question 42, which asks “Which one of the following best describes this person’s employment last week or the most recent employment in the past 5 years?” There are two options under the “SELF-EMPLOYED OR OTHER” category: “Owner of non-incorporated business, professional practice,” or “farm Owner of incorporated business, professional practice, or farm.” We also restrict the sample to those who worked in the year prior to the survey.
Acknowledgments
This data brief is part of The Equitable Recovery and Entrepreneurship Project (TEREP), an initiative of the UCLA Latino Policy and Politics Institute (UCLA LPPI) and the UCLA Center for Neighborhood Knowledge (UCLA CNK) that examines the experiences of entrepreneurs of color to inform strategies for small business resilience and equitable economic growth. The analysis presented here draws on data originally collected through this joint research effort.
This report was made possible by the generous support of JPMorgan Chase Global Philanthropy and The James Irvine Foundation. The authors would like to thank Chhandara Pech from UCLA CNK for review of this brief.


Figure 4. Share of Businesses Reporting Key Needs Over the Next Six Months
Source: LPPI analysis of the Small Business Pulse Survey from the U.S. Bureau of the Census.