Vote Choice of Latino Voters in the 2020 U.S. Senate Elections
EXECUTIVE SUMMARY
The 2020 elections highlighted the diversity and importance of Latino voters in U.S. politics. Despite Latino voters’ overall support of Democratic candidates during this election cycle, an increase in support for Donald Trump among some Latino voters reminded pundits of the complexity of this growing segment of the electorate. While most recognize that Latinos are not a monolith, Latino-vote experts still disagree on whether the gains by Donald Trump among Latinos in 2020 signaled the start of a long-lasting trend that could reshape the electoral landscape in 2022 and 2024 or were simply a return to the level of Latino support for Republicans that existed prior to 2016.
In this data brief, we inform this debate by analyzing the electoral choices of Latino voters in six recent U.S. Senate races across five states: Arizona, Colorado, Georgia, New Mexico, and Texas. In addition to exploring the choices of Latino voters for the U.S. Senate, we present data that show the frequency at which Latino voters split their ballots between Presidential and Senate candidates of different parties, and compare this to white, non-Hispanic voting trends. These data illuminate whether Trump’s inroads with Latino voters—or Joe Biden’s loss of Latino support—also resulted in inroads for Republicans in competitive seats in the U.S. Senate.
Our main findings are:
- Latino voters supported the Democratic candidates for U.S. Senate by wide margins across the five states analyzed. There is no evidence of a “drop-off” in Democratic support for the U.S. Senate.
- Latino voters supported the Democratic Senate candidate over the Republican candidate by at least a 3-1 margin in Arizona, Colorado, and Georgia.
- Latinos favored the Democratic senate candidate by about a 2-1 margin in New Mexico and Texas.
- By contrast, in the states we analyzed, the majority of white voters supported both Donald Trump and the Republican candidates for Senate.
- In the states analyzed, except Texas, the Democratic candidates for Senate outperformed Joe Biden with Latino voters.
- In Arizona, Colorado, and New Mexico, between 2% and 3% of Latino voters split their ballots by voting for Donald Trump and the Democratic candidate for U.S. Senate.
- In Georgia, a state that flipped from Republican to Democrat in both the Presidential and U.S. Senate elections, the Democratic candidates in the 2021 Senate runoffs outperformed Joe Biden by more than 10 percentage points.
- In Texas, where the Democratic candidate for U.S. Senate lost to the Republican incumbent by more than 10% of the vote, Latino voters did not split their ballots and supported Biden and the Democratic candidate for U.S. Senate at similar rates.
- Among white voters, the Republican candidates for U.S. Senate generally outperformed Donald Trump except in Arizona and Georgia. In Colorado, New Mexico, and Texas, between 3% and 4% of white voters who cast a ballot for the Republican Senate candidate did not cast one for Donald Trump. In Arizona and Georgia, white voters who supported Senate Republicans supported Donald Trump at similar levels.
These data show that despite the overwhelming support for Democrats among Latino voters, a not insignificant number are persuadable swing voters. However, the data do not confirm a massive or uniform defection away from the Democratic Party. Latino voters still chose the Democratic candidates over the Republican ones by great margins. But as the Latino electorate continues to grow, these swing Latino voters can be decisive in very competitive races. Heading into the 2022 midterm election cycle, candidates from all political parties must understand the growing importance of this electorate and the need to invest in culturally competent and sustained voter engagement and mobilization strategies if they want to earn their votes.
INTRODUCTION
The 2020 elections highlighted the diversity and importance of Latino voters in U.S. politics. Despite Latino voters’ overall support of Democratic candidates during this election cycle, an increase in support for Donald Trump among some Latino voters reminded pundits of the complexity of this growing segment of the electorate. While most recognize that Latinos are not a monolith, Latino-vote experts still disagree on whether the gains by Donald Trump among Latinos in 2020 signaled the start of a long-lasting trend that could reshape the electoral landscape in 2022 and 2024 or were simply a return to the level of Latino support for Republicans that existed prior to 2016.
In this data brief, we inform this debate by analyzing the electoral choices of Latino voters in six recent U.S. Senate races across five states: Arizona, Colorado, Georgia, New Mexico, and Texas. In addition to exploring the choices of Latino voters for the U.S. Senate, we present data that show the frequency at which Latino voters split their ballots between Presidential and Senate candidates of different parties. These data illuminate whether Trump’s inroads with Latino voters—or Joe Biden’s loss of Latino support—also resulted in inroads for competitive seats in the U.S. Senate.
METHODOLOGY
To approximate the vote preference of Latino voters as closely as possible, we merged two datasets—one with demographic information and a second with election results at the precinct level. In the first dataset, we estimated the Latino share of all registered voters in each precinct. Most simply, voting precincts represent neighborhoods. The second dataset is a compilation of election results at the precinct level, collected directly from county clerks and boards of elections. Merging these two datasets, we can ascertain the relationship between the concentration of Latino voters in a precinct and the vote preference for Senate candidates.
To estimate the support among Latino voters for each candidate, we ran a King’s ecological inference model (EI). EI is the most commonly used technique to estimate individual-level voting behavior from aggregate-level data.1 We also ran an ecological inference of rows by columns (R x C) as a robustness check, and since both models yielded similar estimates, we present the results from our King’s EI across all five states.
By analyzing ballots cast rather than relying on exit polls, we avoided the errors that emerge from exit interviews due to small samples, unrepresentative selection of survey respondents, incomplete understanding of early and absentee voters, and language bias.2

In Arizona, the 2020 U.S. Senate race was a special election for the last two years of John McCain’s term. Republican Senator Martha McSally had been appointed to the seat in 2018 after the death of McCain.3
Latinos represent about one-quarter (25.2%) of Arizona’s registered voters, making them the second largest racial or ethnic voting bloc after non-Hispanic whites.4 Approximately 840,000 Latinos voted in the 2020 election.5
Latino voters supported the Democratic candidates for U.S. President and Senate in Arizona by a 3-1 margin over their Republican rivals. As seen in Figure 1, more than 80% of Latino voters supported Mark Kelly and more than 78% voted for Joe Biden. For comparison, less than one-third of white voters in Arizona supported either Democratic candidate (see Figure 1).
Figure 1: Support for Mark Kelly (U.S. Senate) and Joe Biden by Latino and White Voters in the 2020 General Election.
Source: UCLA-LPPI estimates based on a King’s ecological inference run on results from 1,513 precincts in Arizona.
Notes: For a precinct-by-precinct illustration of ballot-splitting behavior based on the density of Latino or voters in each precinct, please see the Appendix.
While Latino voters supported both Mark Kelly and Joe Biden in overwhelming numbers, Kelly’s margin was 2.8 percentage points larger than Biden’s (see Table 1). This means that almost 24,000 Latino voters in Arizona voted for Donald Trump for President and split their ballot with the Democratic candidate. In comparison, only 0.5% of white voters supported Trump and split their ballot with the Democratic candidate for U.S. Senate.
Table 1. Split in Support for Mark Kelly (U.S. Senate) and Joe Biden by Latino and White Voters in Arizona in the November 2020 General Election.
Source: UCLA-LPPI estimates based on a King’s ecological inference model run on results from 1,513 precincts in Arizona.
Notes: For a precinct-by-precinct illustration of ballot-splitting behavior based on the density of Latino voters in each precinct, please see the Appendix.

In Colorado, the 2020 U.S. Senate race was one of the most closely watched in the nation for its role in determining whether Democrats would take control of the Senate. The incumbent, Republican Cory Gardner, had won an upset victory in 2014 against a Democratic Senator. The Democratic challenger in 2020, John Hickenlooper—former Colorado governor and Denver mayor—entered the race in a strong position.6 Although the race had become more competitive after a primary challenge, Hickenlooper won the race, flipping the seat.
An estimated 323,000 Latinos in Colorado were registered to vote during the 2020 election, accounting for 10.4% of the state’s registered voter population and 1.8% of all U.S. Latino registered voters.7 The U.S. Census estimates that 315,000 Latino voters cast a ballot in Colorado in November 2020.8
Latino voters supported the Democratic candidates for U.S. President and Senate in Colorado by a 3-1 margin over their Republican rivals. As seen in Figure 2, about 76% of Latino voters supported John Hickenlooper and more than 73% voted for Biden. In contrast, less than half of white voters in Colorado supported either Democratic candidate (see Figure 2).
Figure 2: Support for John Hickenlooper (U.S. Senate) and Joe Biden by Latino and White Voters in Colorado in the 2020 General Election.
Source: UCLA-LPPI estimates based on a King’s ecological inference run on results from 3,089 precincts in Colorado.
Notes: For a precinct-by-precinct illustration of ballot-splitting behavior based on the density of Latino voters in each precinct, please see the Appendix.
Even though Latino voters supported both John Hickenlooper and Joe Biden in overwhelming numbers, Hickenlooper’s margin was 2.3 percentage points larger than Biden’s (see Table 2). In contrast, the split among white voters was larger and in the opposite direction than the split among Latinos: About 3.4% of white voters supported Joe Biden for President and split their ballot with the Republican Senate candidate, Cory Gardner.
Table 2. Split in Support between John Hickenlooper (U.S. Senate) and Joe Biden by Latino and White Voters in the November 2020 General Election.
Source: UCLA-LPPI estimates based on a King’s ecological inference run on results from 3,089 precincts in Colorado.
Notes: For a precinct-by-precinct illustration of ballot-splitting behavior based on the density of Latino voters in each precinct, please see the Appendix.

In Georgia, Democrats Jon Ossoff and Raphael Warnock defeated Republican incumbents David Perdue and Kelly Loeffler in the 2021 U.S. Senate runoff elections. The elections played a pivotal role in the fight for control of the U.S. Senate.9
An estimated 178,000 Latinos in Georgia voted in the 2020 election, representing 3.6% of the state’s voters.10 Despite their relatively small numbers, Latino voters were pivotal in the Presidential election, which in Georgia was decided by fewer than 12,000 votes.
Latino voters in Georgia supported the Democratic candidates for U.S. Senate by a 3-1 margin over their Republican rivals, and supported Joe Biden at a 2-1 margin over Donald Trump. As seen in Figure 3, between 79% and 80% of Latino voters supported Jon Ossoff and Raphael Warnock, and 67% voted for Biden. For comparison, less than 20% of white voters in Georgia supported any of the three Democratic candidates (see Figure 3).
Figure 3: Support for Raphael Warnock (U.S. Senate), John Ossoff (U.S. Senate), and Joe Biden by Latino and White Voters in Georgia’s 2020 Presidential Election and 2021 U.S. Senate Runoff Elections.
Source: UCLA-LPPI estimates based on a King’s ecological inference run on results from 2,651 precincts in Georgia.
Notes: For a precinct-by-precinct illustration of ballot-splitting behavior based on the density of Latino voters in each precinct, please see the Appendix.
Despite widespread support for Joe Biden among Georgia’s Latino voters, the Democratic candidates for U.S. Senate outperformed Biden by more than 10 percentage points (see Table 3). Warnock and Ossoff outperformed Biden by 13.2 and 12.1 percentage points respectively. As seen in Table 3, Ossoff and Warnock also outperformed Biden among white voters, but the rate of ballot splitting was less than 1 percentage point.
Table 3. Split in Support between Raphael Warnock (U.S. Senate), John Ossoff (U.S. Senate), and Joe Biden by Latino and White Voters in the November 2020 General Election and the 2021 U.S. Senate Runoff Elections.
Source: UCLA-LPPI estimates based on a King’s ecological inference run on results from 2,651 precincts in Georgia.
Notes: For a precinct-by-precinct illustration of ballot-splitting behavior based on the density of Latino voters in each precinct, please see the Appendix.

In New Mexico in 2020, Democratic U.S. Rep. Ben Ray Luján, a six-term Congressman from northern New Mexico, defeated Republican candidate Mark Ronchetti to win a seat in the U.S. Senate. Luján had risen to the No. 4 position in Democratic House leadership and ran uncontested in the primary. His election signals the emergence of Latino political leadership in the state with the largest share of Hispanic residents.11
Latinos in New Mexico represent 38.9% of the state’s total registered voters and 2% of all Latino registered voters in the country.12 The U.S. Census Bureau estimates that 290,000 Latino voters cast a ballot in the 2020 general election.13
Latino voters in New Mexico supported the Democratic candidates for U.S. Senate and President by a 2-1 margin over their Republican rivals. As seen in Figure 4, about 63% of Latino voters cast a ballot for Ben Ray Luján and about 61% voted for Biden. By contrast, less than 40% of white voters in Georgia supported Luján, while about 41% supported Joe Biden (see Figure 4).
Figure 4: Support for Ben Ray Luján (U.S. Senate) and Joe Biden by Latino and White Voters in New Mexico in the 2020 General Election.
Source: UCLA-LPPI estimates based on a King’s ecological inference run on results from 1,964 precincts in New Mexico.
Notes: For a precinct-by-precinct illustration of ballot-splitting behavior based on the density of Latino voters in each precinct, please see the Appendix.
Even though Latino voters supported both Luján and Joe Biden in overwhelming numbers, Lujan’s margin was 1.9 percentage points larger than Biden’s (see Table 4). The split among white voters was larger and in the opposite direction than the split among Latinos. About 4.1% of white voters supported Joe Biden for President and split their ballot with the Republican Senate candidate, Mark Ronchetti.
Table 4. Split in Support between Ben Ray Luján (U.S. Senate) and Joe Biden by Latino and White Voters in the November 2020 General Election.
Source: UCLA-LPPI estimates based on a King’s ecological inference run on results from 1,964 precincts in New Mexico.
Notes: For a precinct-by-precinct illustration of ballot-splitting behavior based on the density of Latino voters in each precinct, please see the Appendix.

In Texas, Republican Sen. John Cornyn defeated Democratic challenger MJ Hegar in the 2020 U.S. Senate race. Hegar had momentum from Hillary Clinton’s strong performance in Texas in 2016 and Beto O’Rourke’s 2018 Senate run against Ted Cruz. Texas’ competitive shift in favor of Democrats is largely due to the growing Latino electorate.14
Slightly more than 5 million Latinos were eligible to vote in Texas during the 2020 election, representing 28.4% of the state’s eligible voter population.15 The U.S. Census Bureau estimates that almost 3 million Latino voters cast a ballot in the 2020 general election in Texas.16
Latino voters in Texas supported the Democratic candidates for U.S. Senate and President by more than a 2-1 margin over their Republican rivals. As seen in Figure 5, around 70% of Latino voters cast a ballot for both Hegar and Biden. In contrast, less than 20% of white voters in Texas supported either Democratic candidate (see Figure 5).
Figure 5: Support for MJ Hegar (U.S. Senate) and Joe Biden by Latino and White Voters in Texas in the 2020 General Election.
Source: UCLA-LPPI estimates based on a King’s ecological inference run on results from 8,475 precincts in Texas.
Notes: For a precinct-by-precinct illustration of ballot-splitting behavior based on the density of Latino voters in each precinct, please see the Appendix.
In contrast to those in the other states analyzed, Latino voters in Texas did not split their ballots between Biden and Hegar (see Table 5). The split among white voters was larger than the split among Latinos. About 2.9% of white voters supported Joe Biden for President and split their ballot with the Republican Senate candidate, John Cornyn.
Table 5. Split in Support between MJ Hegar (U.S. Senate) and Joe Biden by Latino and White Voters in the November 2020 General Election.
Source: UCLA-LPPI estimates based on a King’s ecological inference run on results from 8,475 precincts in Texas.
Notes: For a precinct-by-precinct illustration of ballot-splitting behavior based on the density of Latino voters in each precinct, please see the Appendix.
CONCLUSION
This report provides a comprehensive analysis of the Latino electorate’s vote choice during the 2020 and 2021 U.S. Senate elections in five states. Our precinct-level data shows that Latino voters not only supported the Democratic Senate candidate in the states we observed but cast ballots in comparable or even greater numbers for these candidates than for Joe Biden. During these notable Senate races, the influence of Latino voters helped decide the elections that ultimately secured the majority for Democrats in the U.S. Senate. In states including Arizona, Colorado, Georgia, and New Mexico, Latino voters played a vital role in flipping or securing Senate seats for Democrats. In Texas, where the Democratic candidate lost to the Republican incumbent, the Latino electorate proved influential enough to make the Democratic challenger competitive.
Our report further contradicts the premise that the Latino electorate had a uniform shift toward Republican candidates. However, despite the overwhelming support for Democrats among Latino voters, a sizeable number are persuadable swing voters. As the Latino electorate continues to grow, these swing Latino voters can be decisive in very competitive races. Heading into the 2022 midterm election cycle, candidates from all political parties must understand the growing importance of this electorate and the need to invest in culturally competent and sustained voter engagement and mobilization strategies if they want to earn their votes.
APPENDIX
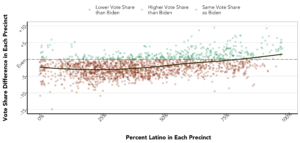
Figure A1. Vote Share Difference between Mark Kelly (U.S. Senate) and Joe Biden by Latino Share of Registered Voters in All Arizona Precincts.
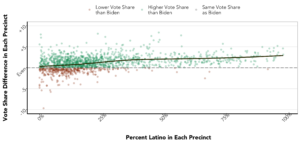
Source: LPPI analysis based on official election results by precinct collected directly from county clerks and boards of elections.
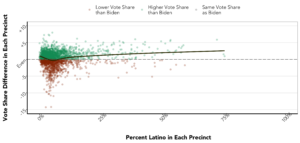
Figure A2. Vote Share Difference between John Hickenlooper (U.S. Senate) and Joe Biden by Latino Share of Registered Voters in All Colorado Precincts.

Source: LPPI analysis based on official election results by precinct collected directly from county clerks and boards of elections.
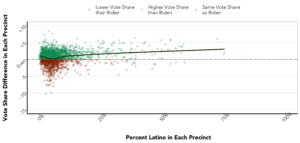
Figure A3. Vote Share Difference between John Ossoff (U.S. Senate) and Joe Biden by Latino Share of Registered Voters in All Georgia Precincts.
Source: LPPI analysis based on official election results by precinct collected directly from county clerks and boards of elections.
Notes: The data for the U.S. Senate election in Georgia comes from the runoff election that took place in January 2021.
Figure A4. Vote Share Difference between Raphael Warnock (U.S. Senate) and Joe Biden by Latino Share of Registered Voters in All Georgia Precincts.
Source: LPPI analysis based on official election results by precinct collected directly from county clerks and boards of elections
Notes: The data for the U.S. Senate election in Georgia comes from the runoff election that took place in January 2021.
Figure A5. Vote Share Difference between Ben Ray Luján (U.S. Senate) and Joe Biden by Latino Share of Registered Voters in All New Mexico Precincts.
Source: LPPI analysis based on official election results by precinct collected directly from county clerks and boards of elections.
Figure A6. Vote Share Difference between MJ Hegar (U.S. Senate) and Joe Biden by Latino Share of Registered Voters in All Texas Precincts.
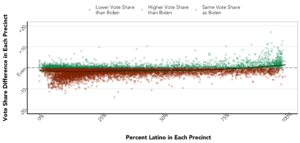
Source: LPPI analysis based on official election results by precinct collected directly from county clerks and boards of elections.
Acknowledgments
As a land grant institution, the UCLA Latino Policy and Politics Institute (LPPI) acknowledges the Gabrielino and Tongva peoples as the traditional land caretakers of Tovaangar (Los Angeles basin, Southern Channel Islands), and that their displacement has enabled the flourishing of UCLA.
This project builds on LPPI’s research on Democracy and Voting Rights and similar studies in 2018 and 2020. LPPI faculty director Dr. Matt Barreto supervised this research but was not a report author.
The authors would like to thank Sonja Diaz, Paul Barragan-Monge, and Gabriella Carmona for their editorial support, LPPI policy fellows Brianna Ruiz and Taemin Ahn for their support in previous drafts of this report, Andrea Cannon for the report design and layout, and Alise Brillault for the dissemination of the report.
Endnotes
1 Matt Barreto, Loren Collingwood, Sergio Garcia-Rios, and Kassra AR Oskooii, “Estimating Candidate Support in Voting Rights Act Cases: Comparing Iterative EI and EI-R×C Methods,” Sociological Methods & Research 51, no. 1 (2022): 271-304.
2 Paul Waldman, “Why the Exit Polls Are Wrong on Latino Votes,” The Washington Post, November 15, 2016, available online. See also Matt Barreto and Gary Segura, “Understanding Latino Voting Strength in 2016 and Beyond: Why Culturally Competent Research Matters,” Journal of Cultural Marketing Strategy 2, no. 2 (2017): 190-201.
3 Bob Christie, “Senate, Governor Races Top Arizona Election Ticket,” Associated Press, November 4, 2018, available online.
4 Michael Herndon, Sonja Diaz, Bryanna Ruiz, and Natalie Masuoka, The Power of the New Majority: A 10 State Analysis of Voters of Color in the 2020 Election (Los Angeles: UCLA Latino Policy & Politics Institute, 2020), available online.
5 U.S. Census Bureau, “Voting and Registration in the Election of November 2020,” Table 4b, accessed July 11, 2022, available online.
6 Morgan Lee and Cedar Attanasio, “Democrats Keep New Mexico Senate Seat, Back Biden,” Associated Press, November 4, 2020, available online.
7 Herndon et al, The Power of the New Majority.
8 U.S. Census Bureau, “Voting and Registration in the Election of November 2020,” Table 4b.
9 Ben Nadler, “Georgia Certifies Democrats Warnock and Ossoff’s Senate Wins,” Associated Press, January 19, 2021, available online.
10 U.S. Census Bureau, “Voting and Registration in the Election of November 2020,” Table 4b.
11 Lee and Attanasio, “Democrats Keep New Mexico Senate Seat, Back Biden.”
12 Herndon et al, The Power of the New Majority.
13 U.S. Census Bureau, “Voting and Registration in the Election of November 2020”, Table 4b.
14 Paul J. Weber, “GOP’s Cornyn Defeats Democratic Challenger MJ Hegar in Texas,” Associated Press, November 4, 2020, available online.
15 Herndon et al, The Power of the New Majority.
16 U.S. Census Bureau, “Voting and Registration in the Election of November 2020,” Table 4b.